Update time! We slowed down a little for some summer fun here in Brisbane, Australia, but we're thoroughly immersed in Seq 2026.1 development again... sunburn and all.
Focus over the past month or two has shifted from fundamental performance work to supporting Seq's new metrics interface. The UI itself is still in a rough state, so I won't go into any detail yet on the core Metrics screen, but I do want to share a glimpse into Seq's internal column-oriented storage architecture through the Columns screen.
The purpose of Columns is to show a breakdown of the space requirements of each individual metric.
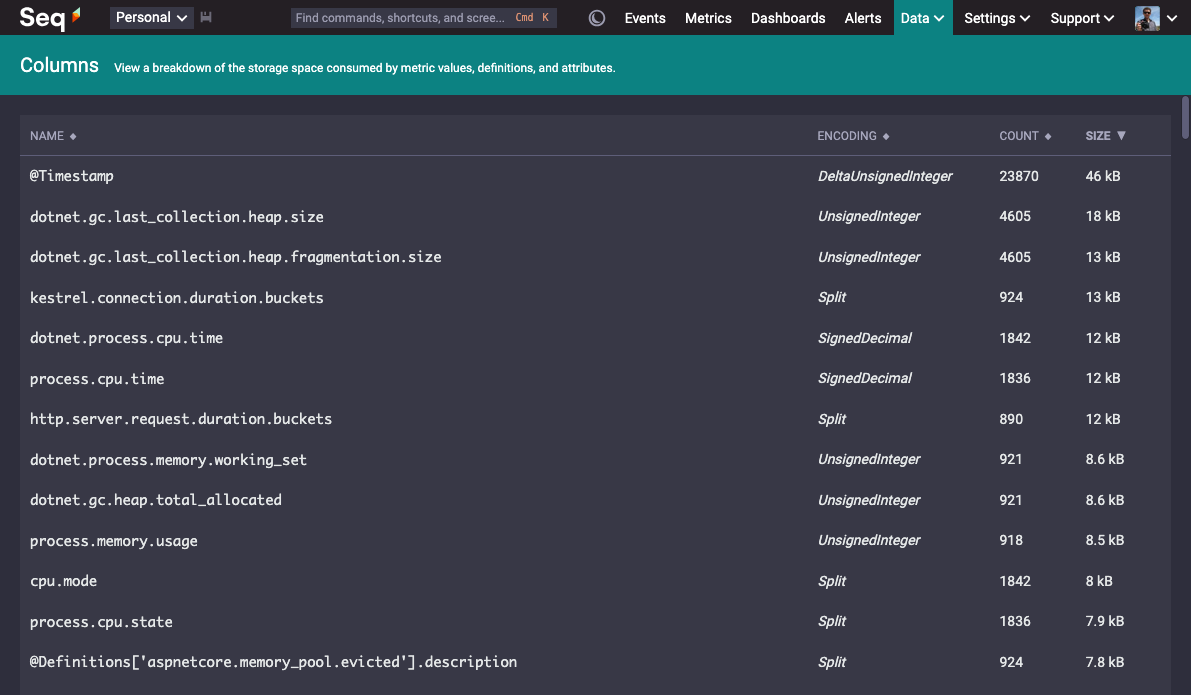
Each row in the table is a physical column on disk, with names mapped into Seq's query language syntax. When you write select sum(dotnet.process.cpu.time) from series, your query will end up pulling that dotnet.process.cpu.time column from disk, reading some portion of the column's total size in bytes, depending on the range of your query.
Metrics, labels, and attributes of various kinds are split and stored separately: if dotnet.process.cpu.time samples carry a cpu.mode label, those labels end up in the cpu.mode column, making reads entirely pay-for-play.
(One nice thing we've been careful to build into the model is that there's no distinction between how metrics and labels are stored or queried. In queries, the metric name dotnet.process.cpu.time is written exactly as it is, and so is cpu.mode, with all the same operations (and performance characteristics) applied to both, since at the storage level they're both columns on an equal footing.)
Columns as it is today shows a few more pieces of information aimed at helping us improve the column store. The count of rows in each column is recorded so that we can gauge how successfully Seq has been able to compress the data in that column. Seq's underlying storage format incorporates a range of encodings (compression schemes) that can be applied to different types of data, so those are included here on Columns, too.
At the very bottom of the screen, you'll see one of the @Definitions columns. It can take a bit to wrap your head around it, but — every individual metric sample is tagged not just with labels and resource attributes, but also its kind, units, and a full human-readable description. Column stores are magic. How column-oriented storage makes this possible, and how we take advantage of it to drive Seq's metrics UI, will be the topic of an upcoming post.
In 2023, we shipped a new storage architecture and native OpenTelemetry log ingestion. 2024 added OpenTelemetry tracing and high-cardinality indexing. In 2025 it was scale-out HA clustering. Three massive years, one after another, and yet 2026 is going to be bigger still! It's exciting to have you on this journey with us 😎👋