The Seq 2026.1 previews are ready to try! New builds are rolling out weekly, with Windows installers hosted on [datalust.co/download] (scroll down to "Preview") and Docker images published to datalust/seq:preview on Docker Hub, or public.ecr.aws/datalust/seq:preview on AWS ECR.
These include first-class OpenTelemetry Metrics support, which is 2026.1's central pillar.
Metrics
On the surface, metrics are just another specialization of timestamped event data, alongside logs and (tracing) spans. In the metrics worldview, a timestamped event becomes a "sample" when it combines a numeric property value, say, roaster_temp, with semantic information about how the value was produced (e.g. value at the time of sampling is a gauge) and how it should be consumed, including its description ("Coffee roaster environmental temperature at exit.") and units (°C).
These minimal constraints and embellishments have a huge effect on how metrics are produced, stored, and visualized. On the producer side, combining numeric values with semantic information means that data can be pre-aggregated using extrema, counts, or bucketing, collapsing the cost of collecting samples, and the bandwith required to transmit them to a collection system. In storage, the regular "timestamped numeric value plus tags" data model works with a range of powerful compression and query evaluation techiques. And, on the consuming side, the semantic information attached to metrics drives visualization without the need for manual query building.
To make the most of the metrics data model, servers generally choose either a timeseries (TSDB) or a columnar storage architecture. The strengths and weaknesses of these two approaches make interesting reading. Here, we only really have space to mention that Seq uses columnar metric storage, because it more elegantly supports a uniform data model that can represent high-cardinality attributes.
Getting metrics into Seq
Seq natively supports the OpenTelemetry Protocol (OTLP) for logs and traces, and this is also Seq's primary metrics ingestion API.
The easiest way to get application metrics into Seq is with the OpenTelemetry SDK. The example below is a "hello, world" metrics demo using the OpenTelemetry .NET SDK.
To follow along, first either install the prevew MSI (links above), or start a Seq 2026.1 preview container:
docker run \
    --name seq \
    -d \
    -p 5341:80 \
    -e ACCEPT_EULA=Y \
    -e SEQ_FIRSTRUN_ADMINPASSWORD=YourPassw0rd! \
    datalust/seq:preview
Log in using admin and the password specified in the command (YourPassw0rd! in the example).
You'll need a new .NET 10 console application with some NuGet packages installed:
mkdir ./hello-metrics
cd ./hello-metrics
dotnet new console
dotnet add package OpenTelemetry.Exporter.OpenTelemetryProtocol
Here's Program.cs:
using System.Diagnostics.Metrics;
using OpenTelemetry;
using OpenTelemetry.Exporter;
using OpenTelemetry.Metrics;
using OpenTelemetry.Resources;

var meter = new Meter("Example.Hello");
var loopCounter = meter.CreateCounter<int>(
    "hello.loop",
    unit: "{loops}",
    description: "The number of times the example loop has run.");

using var meterProvider = Sdk.CreateMeterProviderBuilder()
    .SetResourceBuilder(ResourceBuilder.CreateDefault().AddService("hello-metrics"))
    .AddMeter(meter.Name)
    .AddOtlpExporter((exporter, reader) =>
    {
        exporter.Protocol = OtlpExportProtocol.HttpProtobuf;
        exporter.Endpoint = new Uri("http://localhost:5341/ingest/otlp/v1/metrics");
        reader.TemporalityPreference = MetricReaderTemporalityPreference.Delta;

        // In production settings, it's preferable to accept the SDK defaults here.
        reader.PeriodicExportingMetricReaderOptions.ExportIntervalMilliseconds = 5000;
    })
    .Build();

while (true)
{
    loopCounter.Add(1);
    await Task.Delay(100);
}
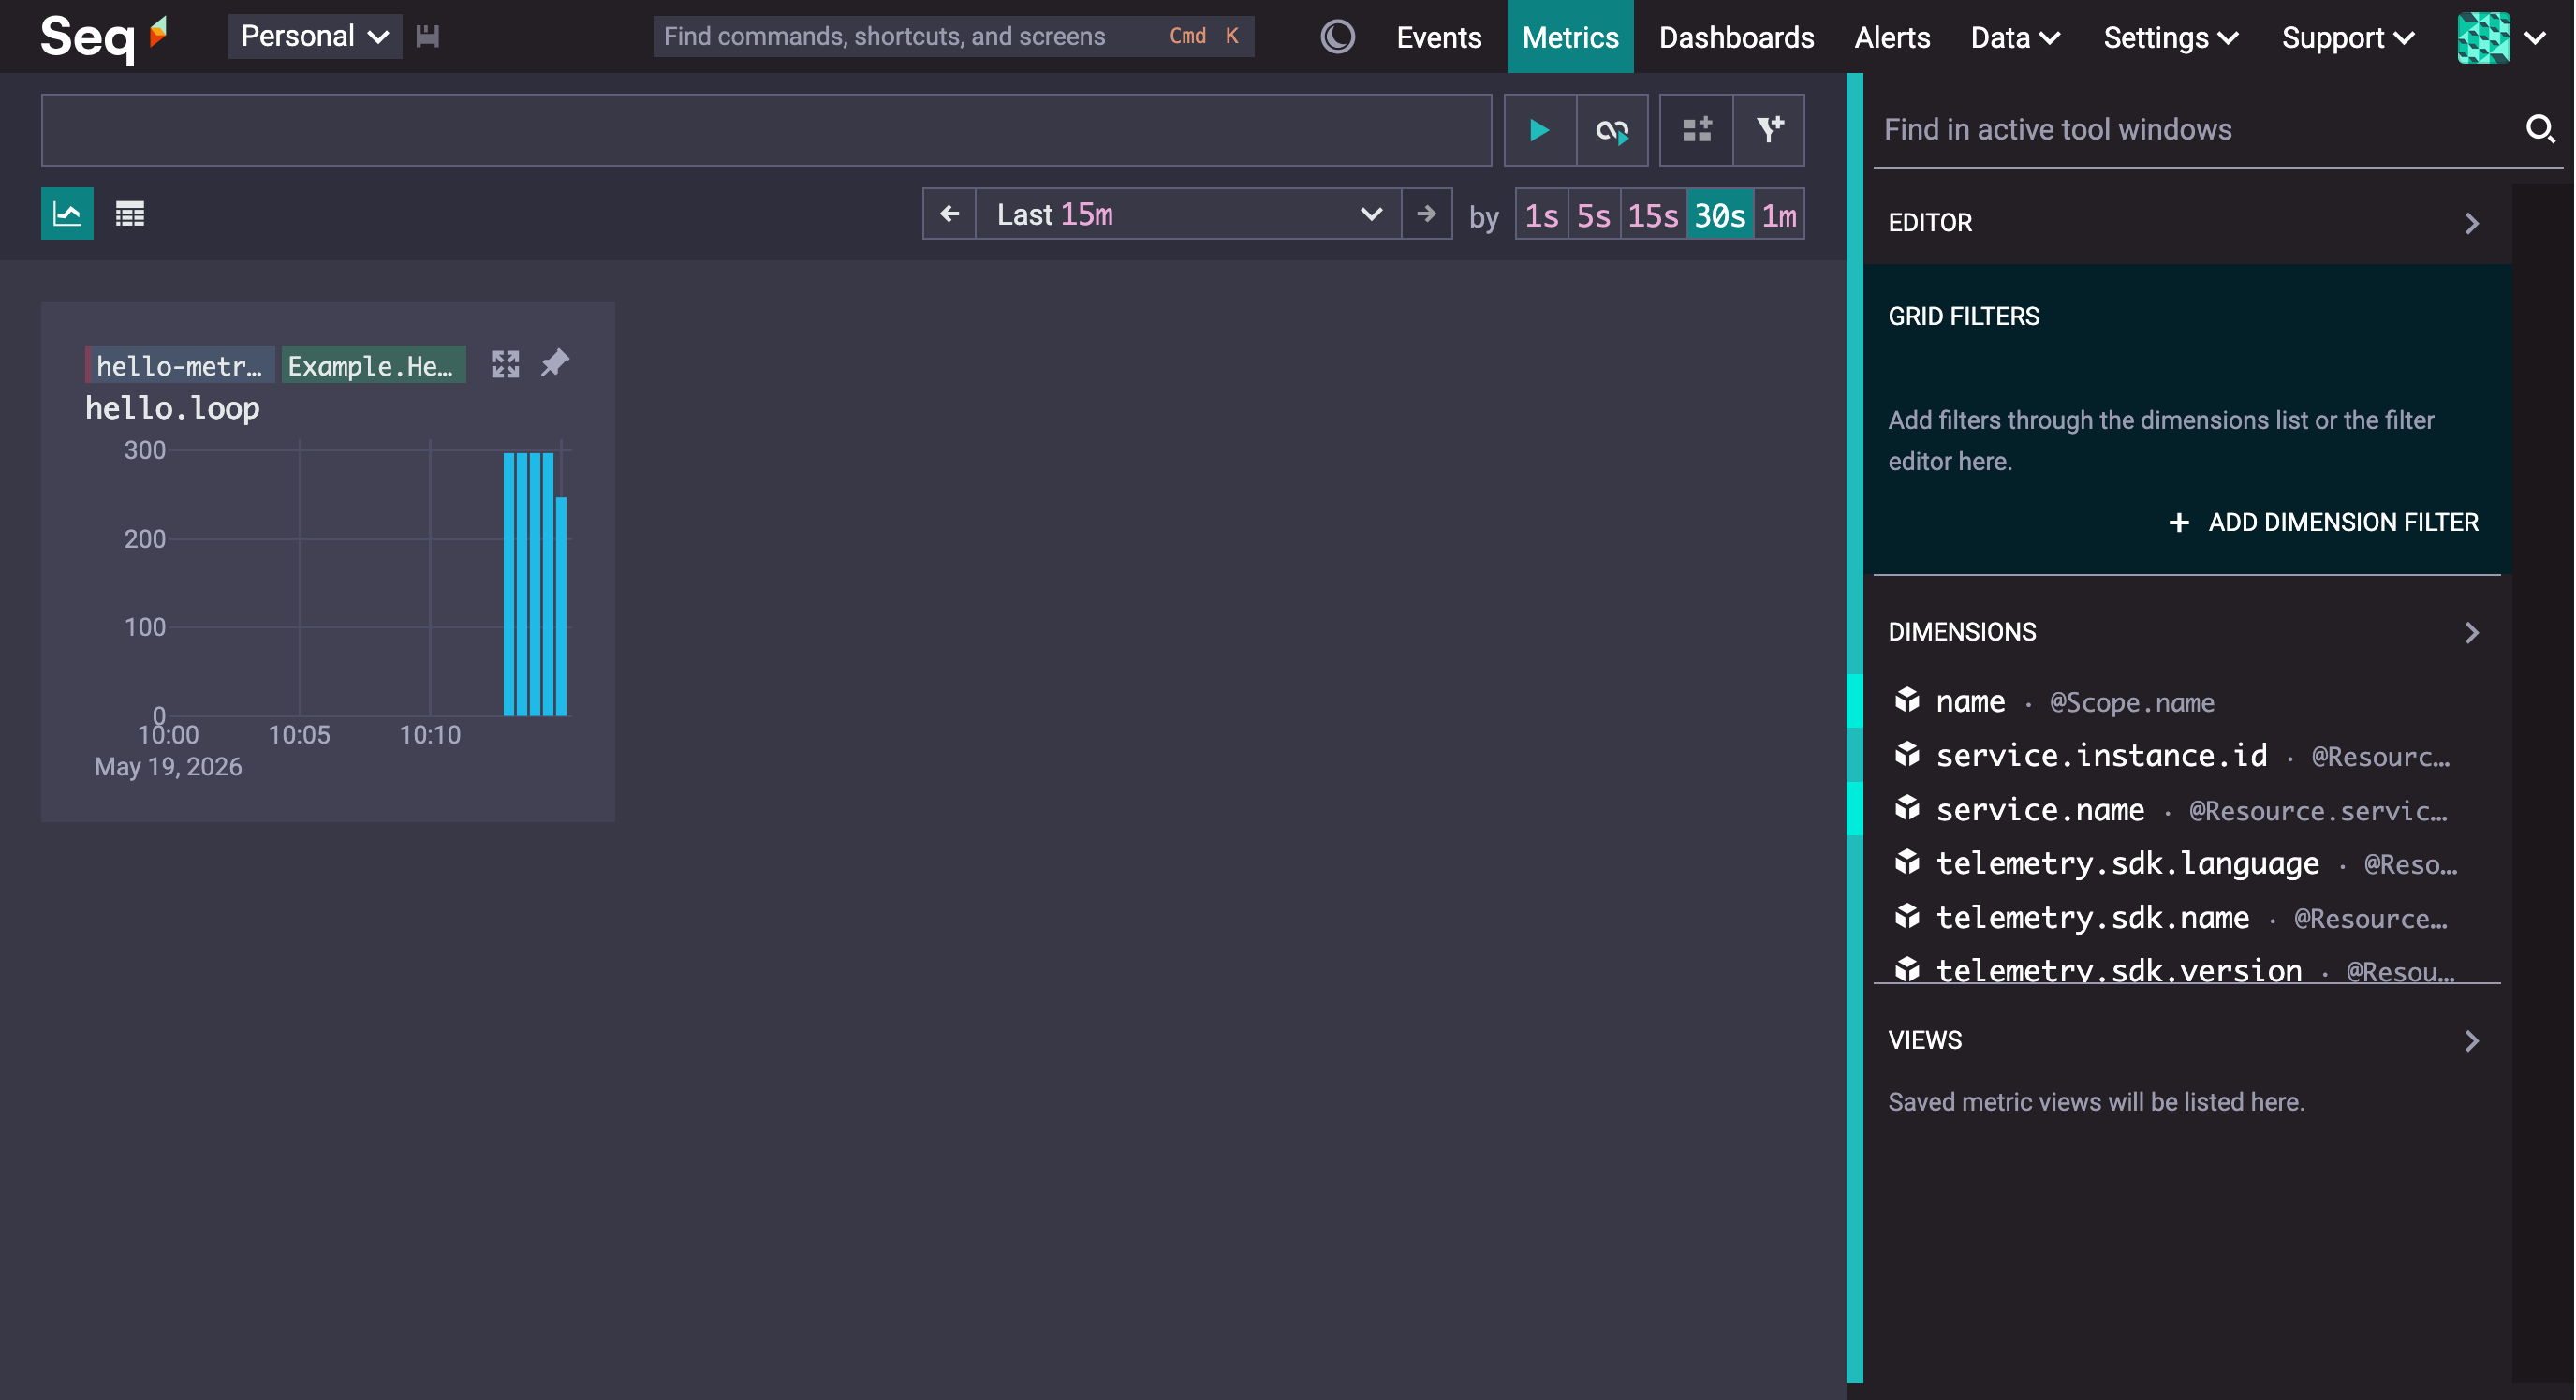
The example defines a counter that's incremented every 100 milliseconds, and sampled every five seconds. The OpenTelemetry SDK is configured to send metrics to Seq running on http://localhost:5341.
Run the example with:
dotnet run
In Seq, navigating to the Metrics screen shows the counter.
Metrics are really easy to use, but we have a few important tips for success:
- Make sure your metric sources are configured to use delta aggregation temporality (counters won't look right otherwise!)
- When recording metrics, don't over-sample. 30-60s is ample for most purposes, and will still generate a lot of points across multiple metrics, services, and application/container instances.
- Metrics ingestion imposes a hard 10-minute arrival window. Late samples will be dropped.
What about Prometheus endpoints? We've extended Seq's pluggable inputs to support what would be needed for a plug-in Prometheus endpoint scraper. If you're interested in sending Prometheus-style metrics to Seq, please chime in on this ticket.
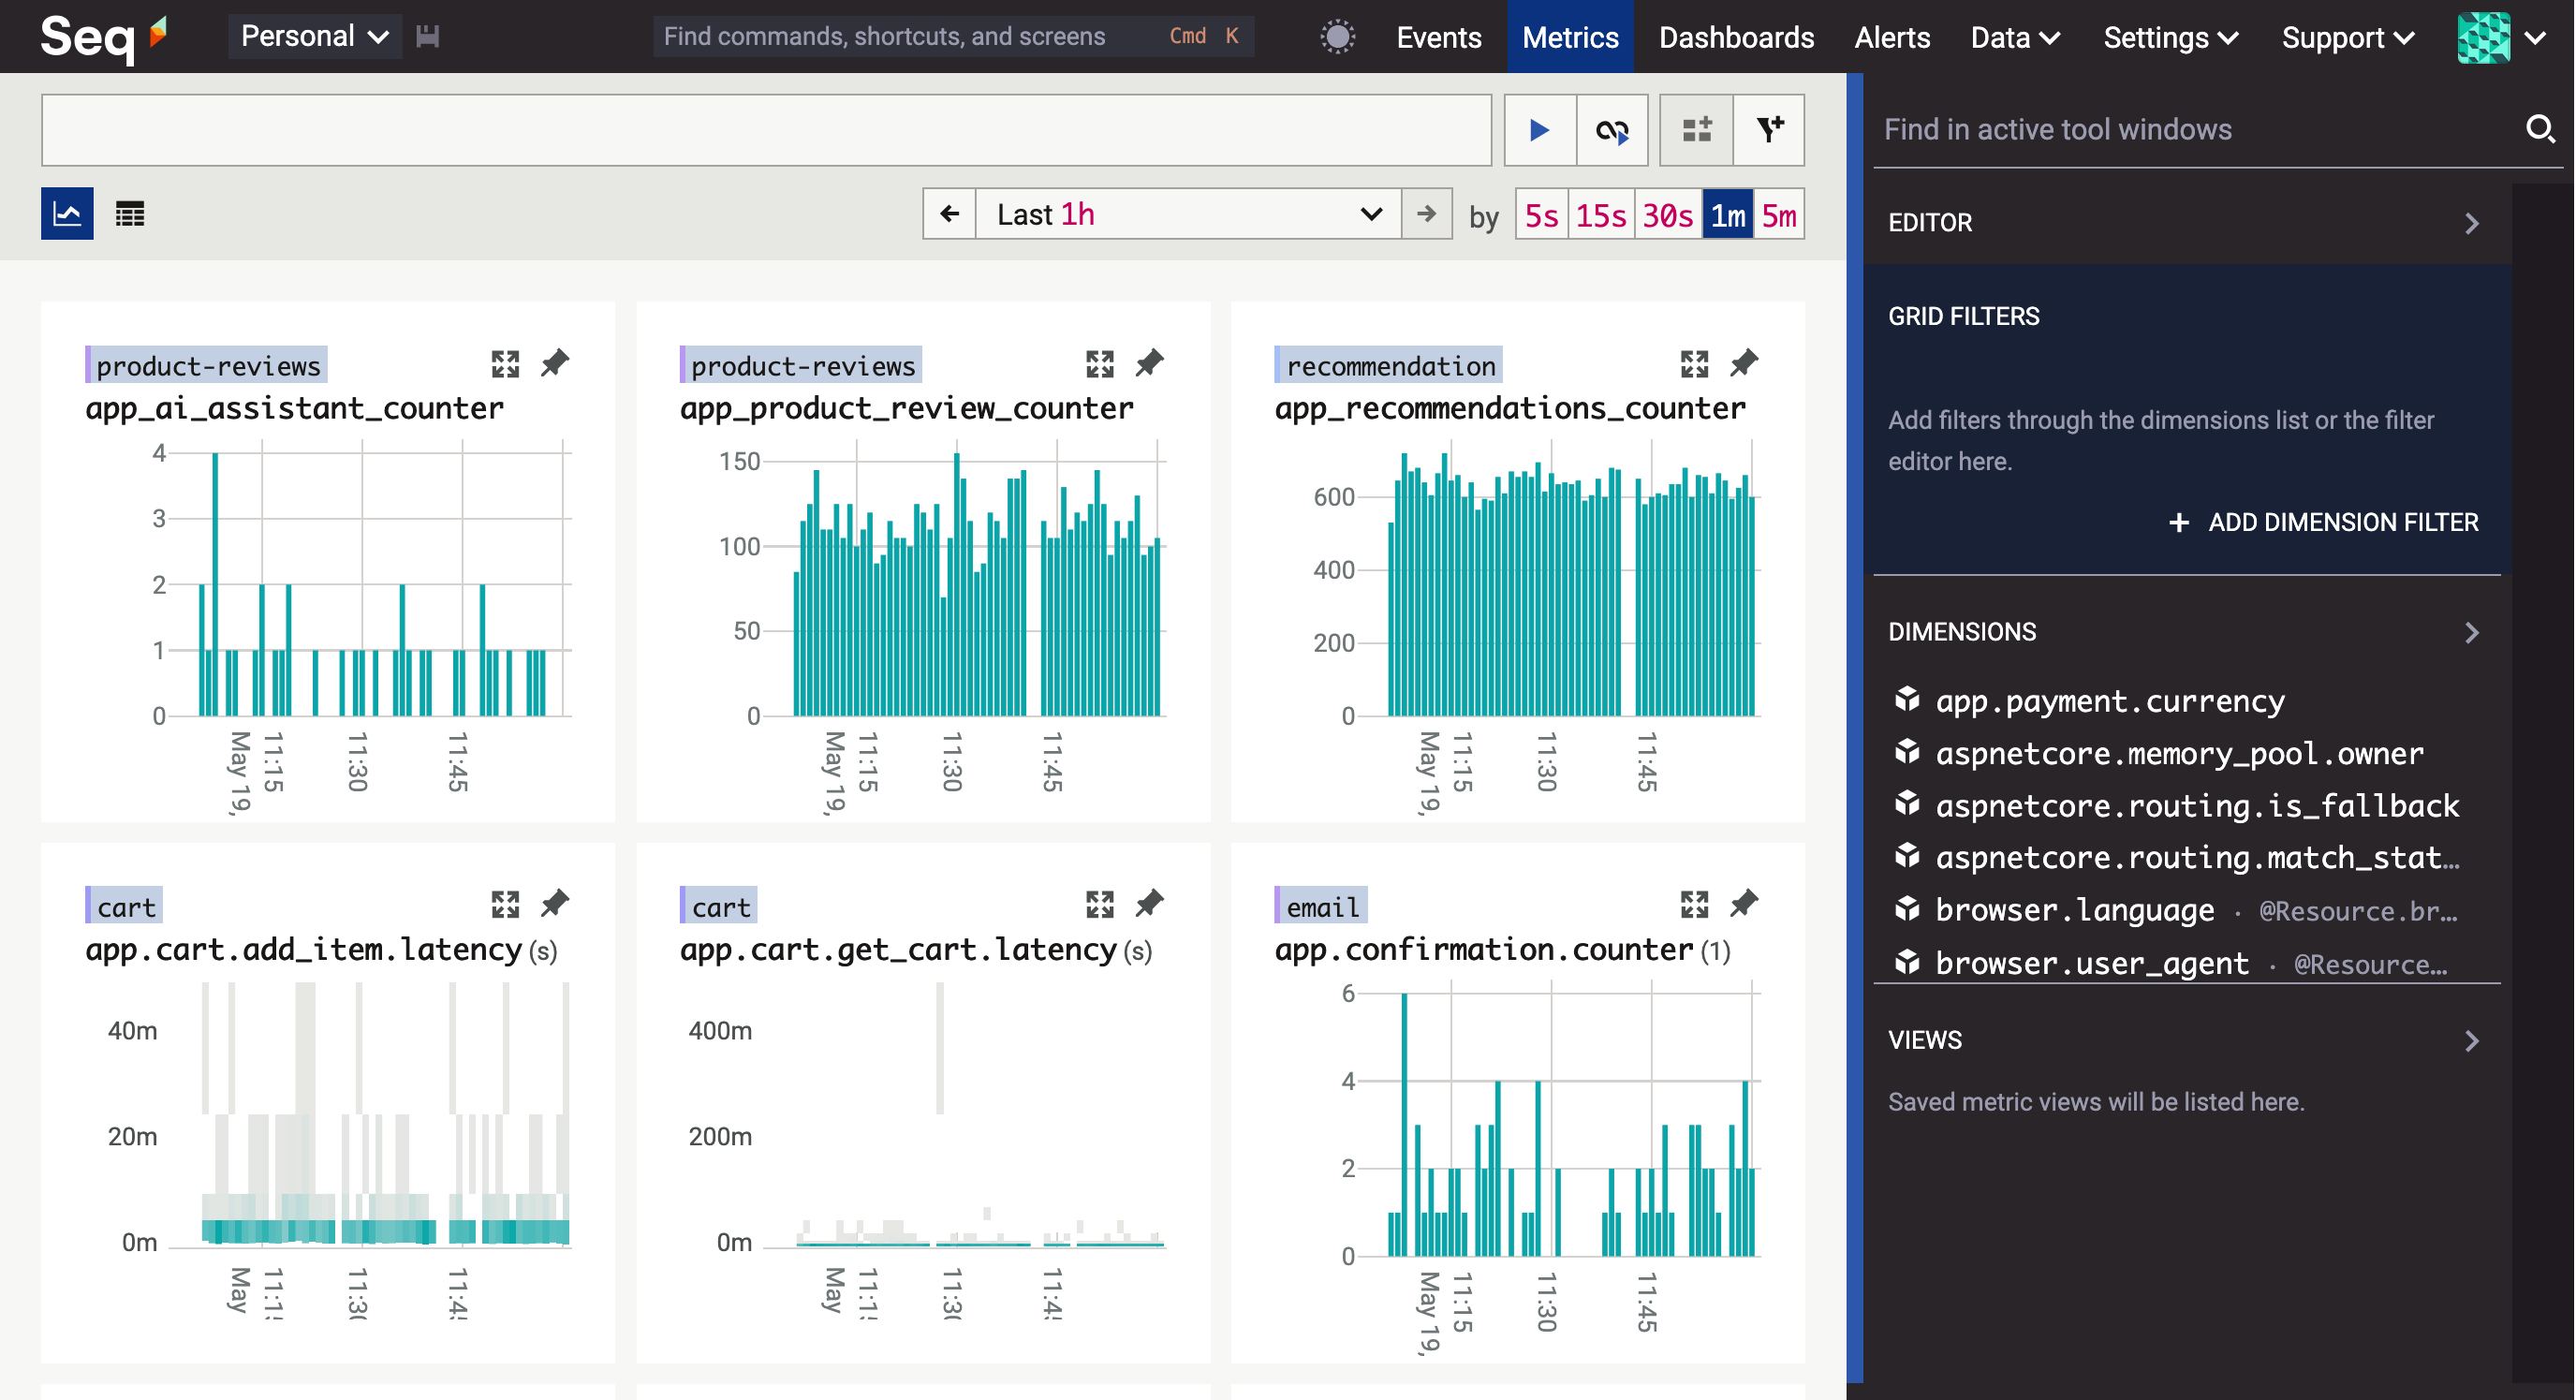
The Metrics screen
Group, search, pin, maximize: here are the four core interactions that the new Metrics screen supports.
Group
When you open Metrics you'll see a grid of charts tagged with service and scope names. If your systems are recording the http.request.duration metric, you'll see a chart for each individual service. Within those services, if multiple different frameworks are handling HTTP requests, you'll also see the metrics broken down per framework. These keys, @Resource.service.name and @Scope.name, are the default "grouping", and you can see this in the right-hand-side view editor.
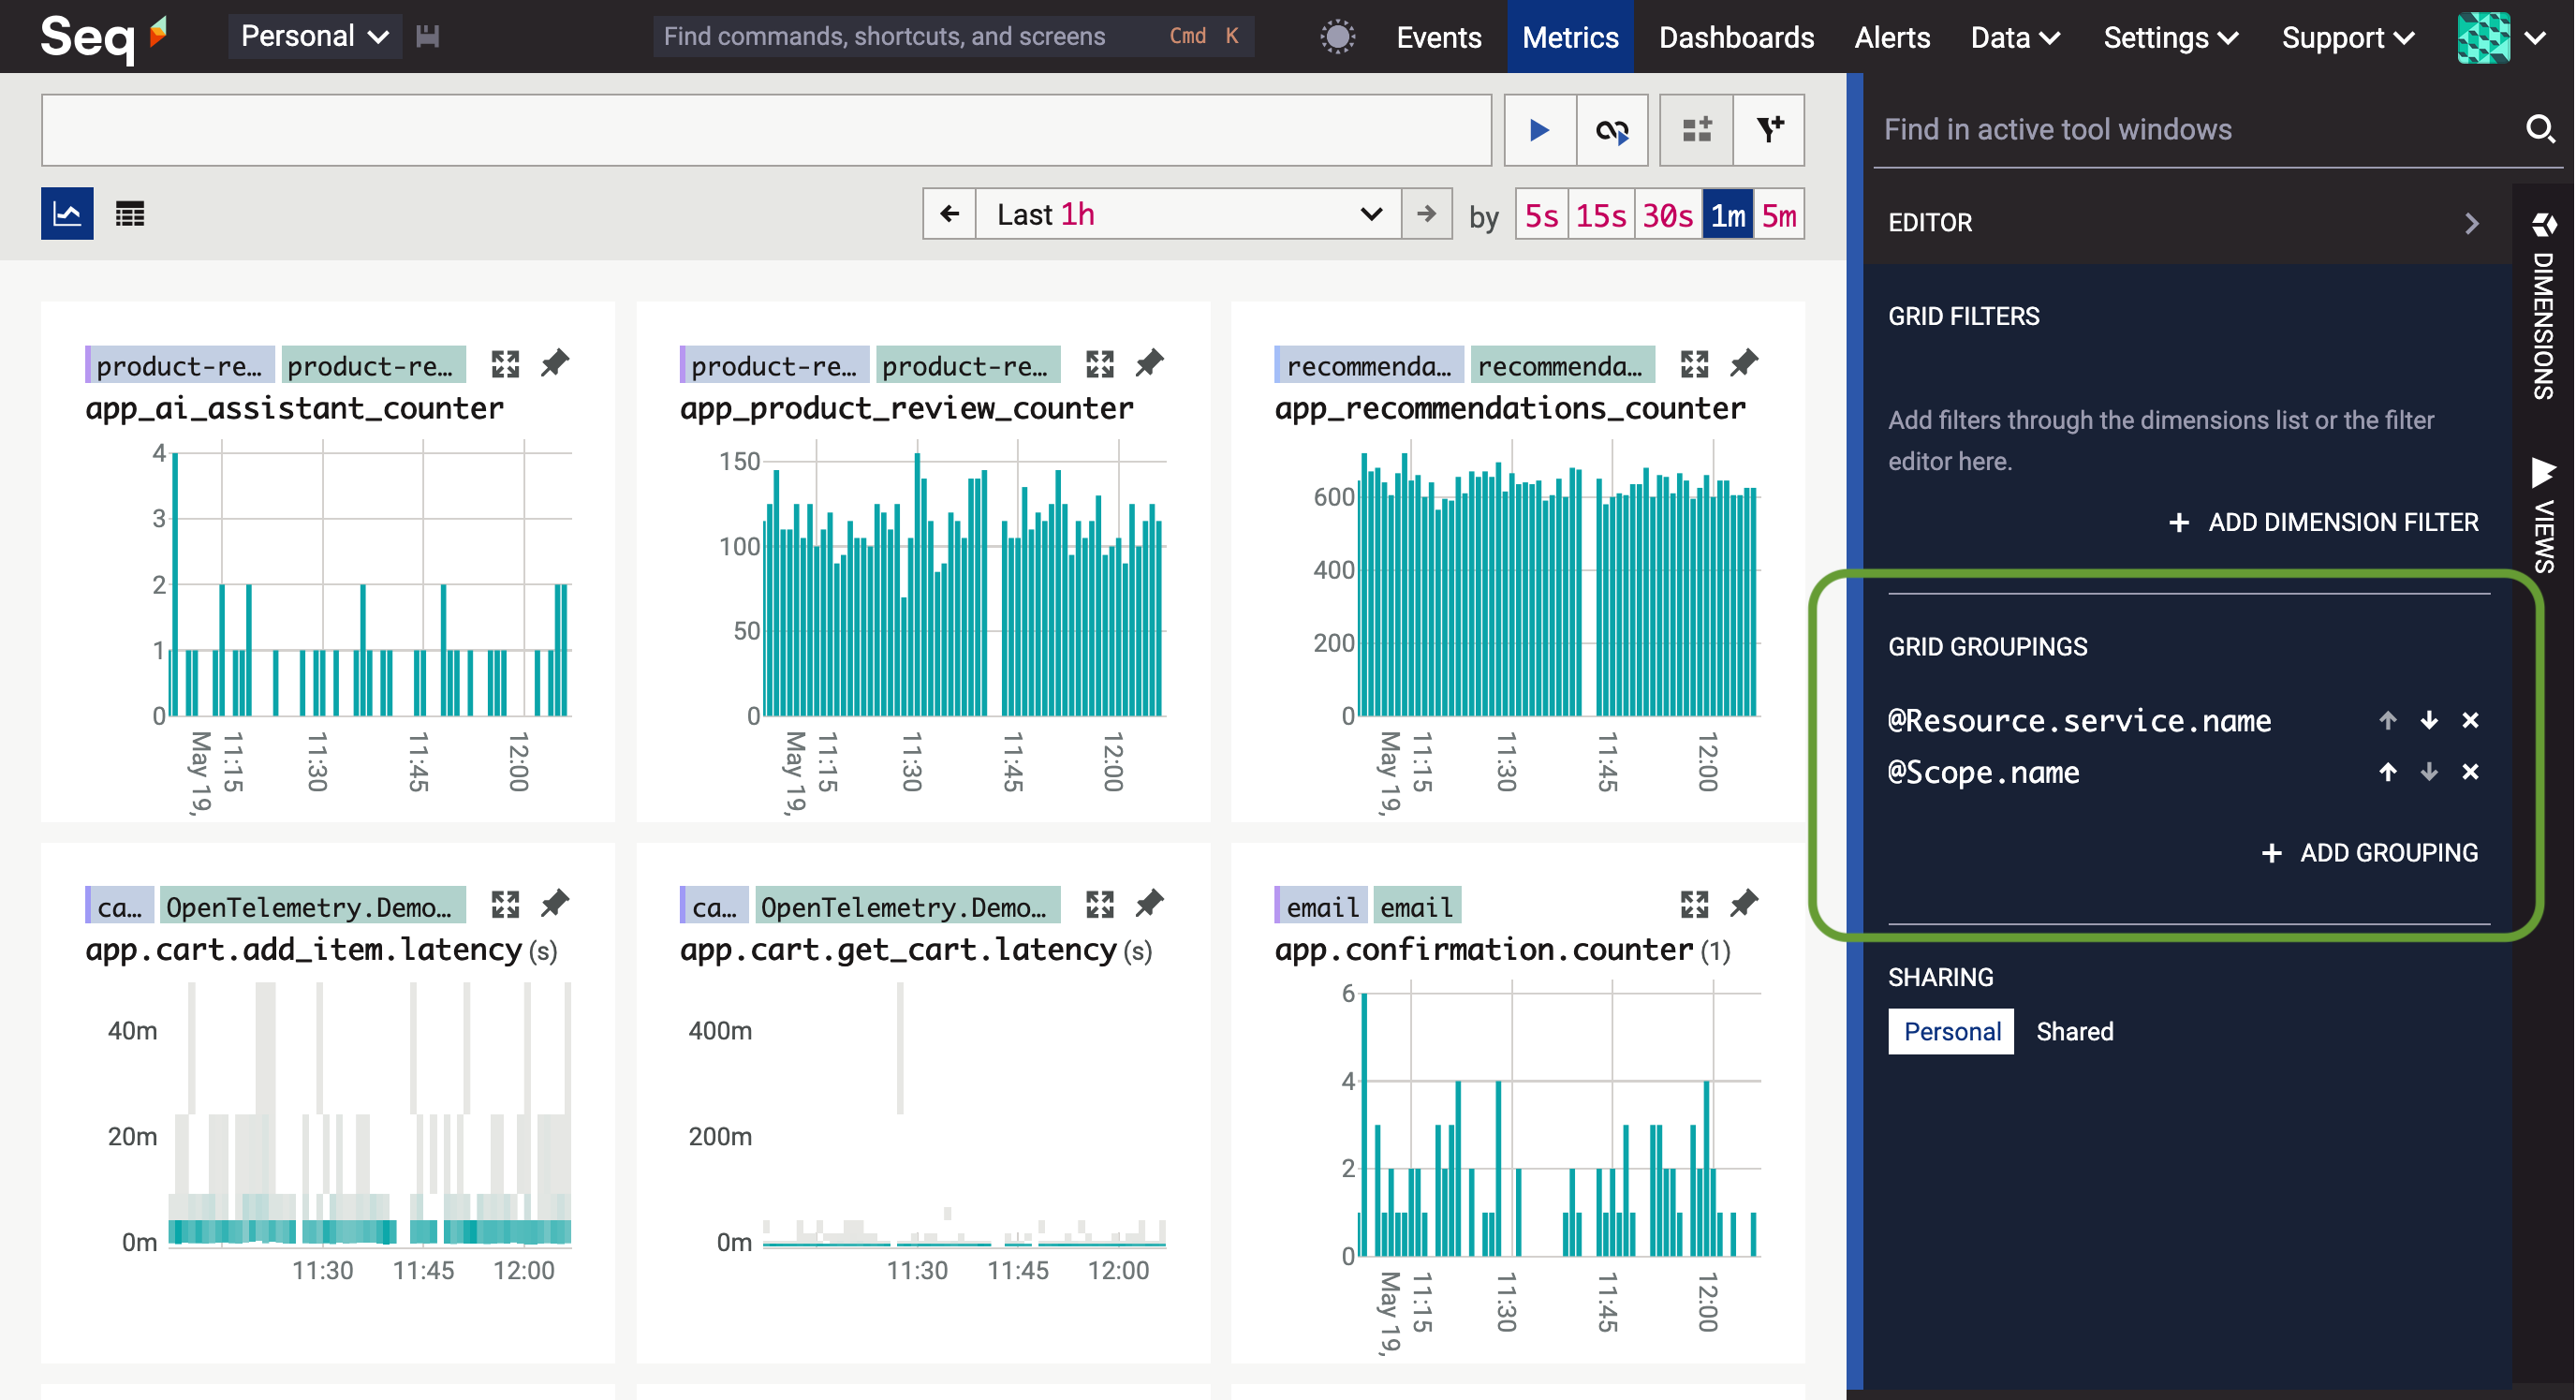
The best grouping will often depend on the task. You can change the grouping in the view editor directly, or by searching the dimensions list and selecting Group after clicking on a dimension name.
Want to see more charts per row? Click the small chart view button just below the search box.
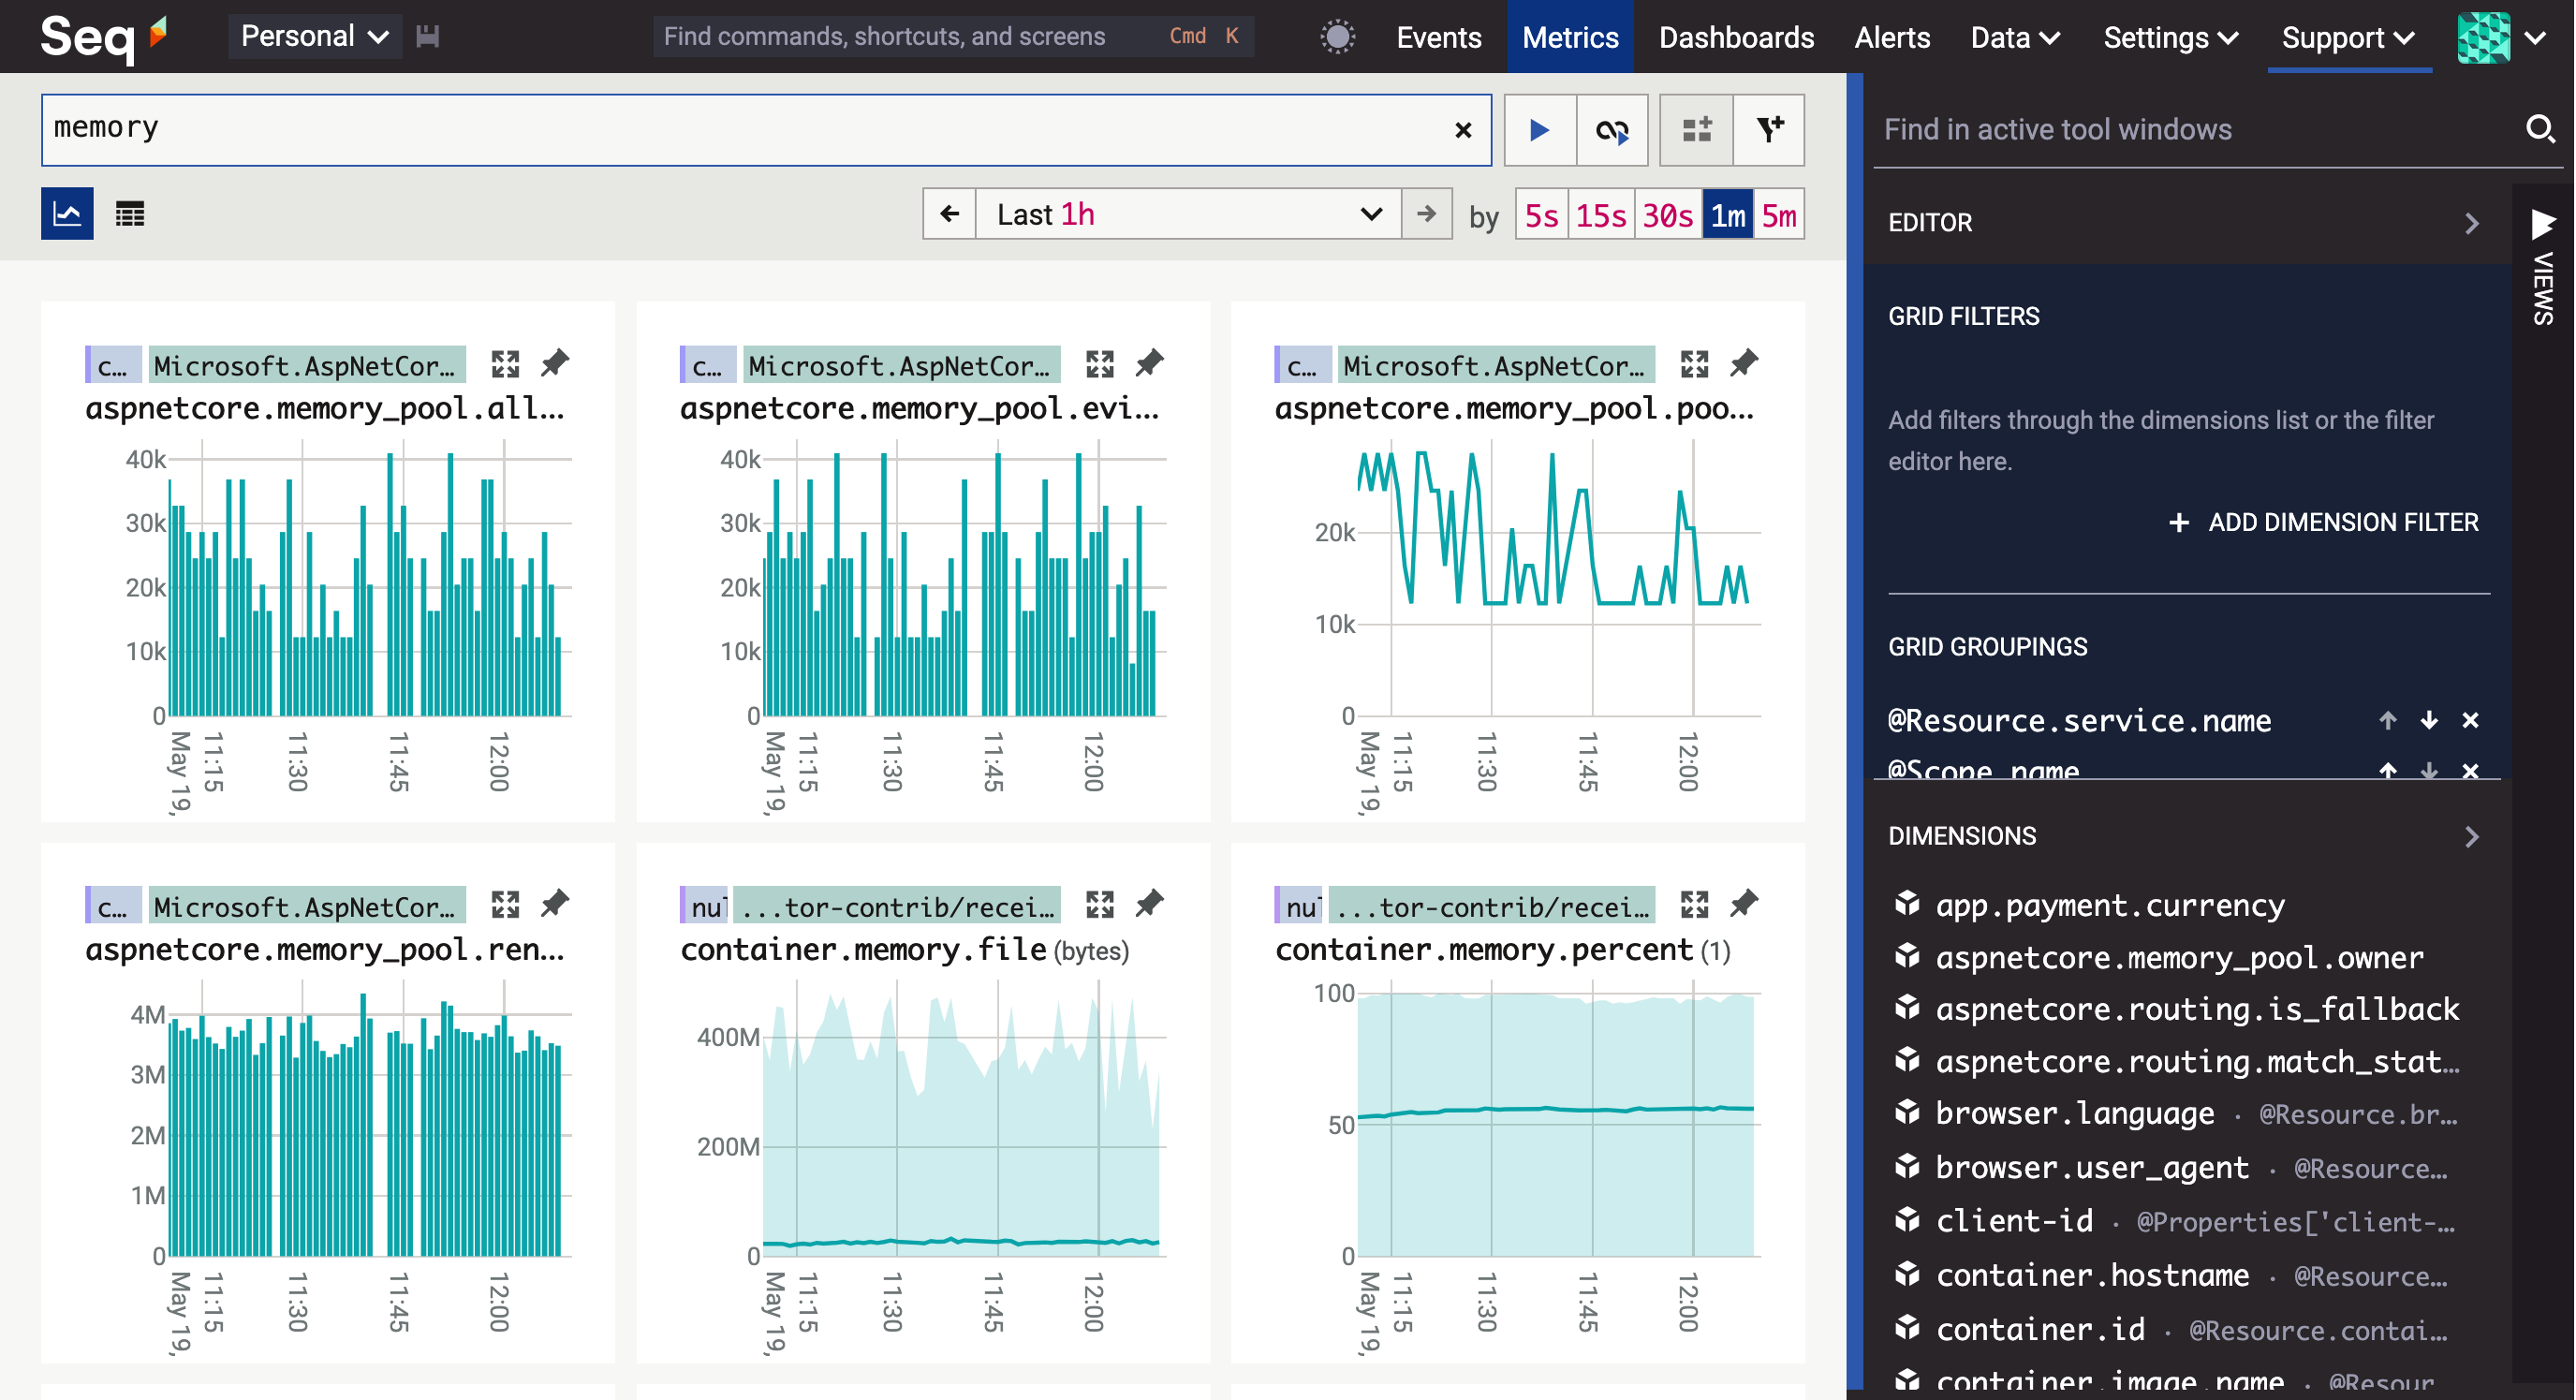
Search
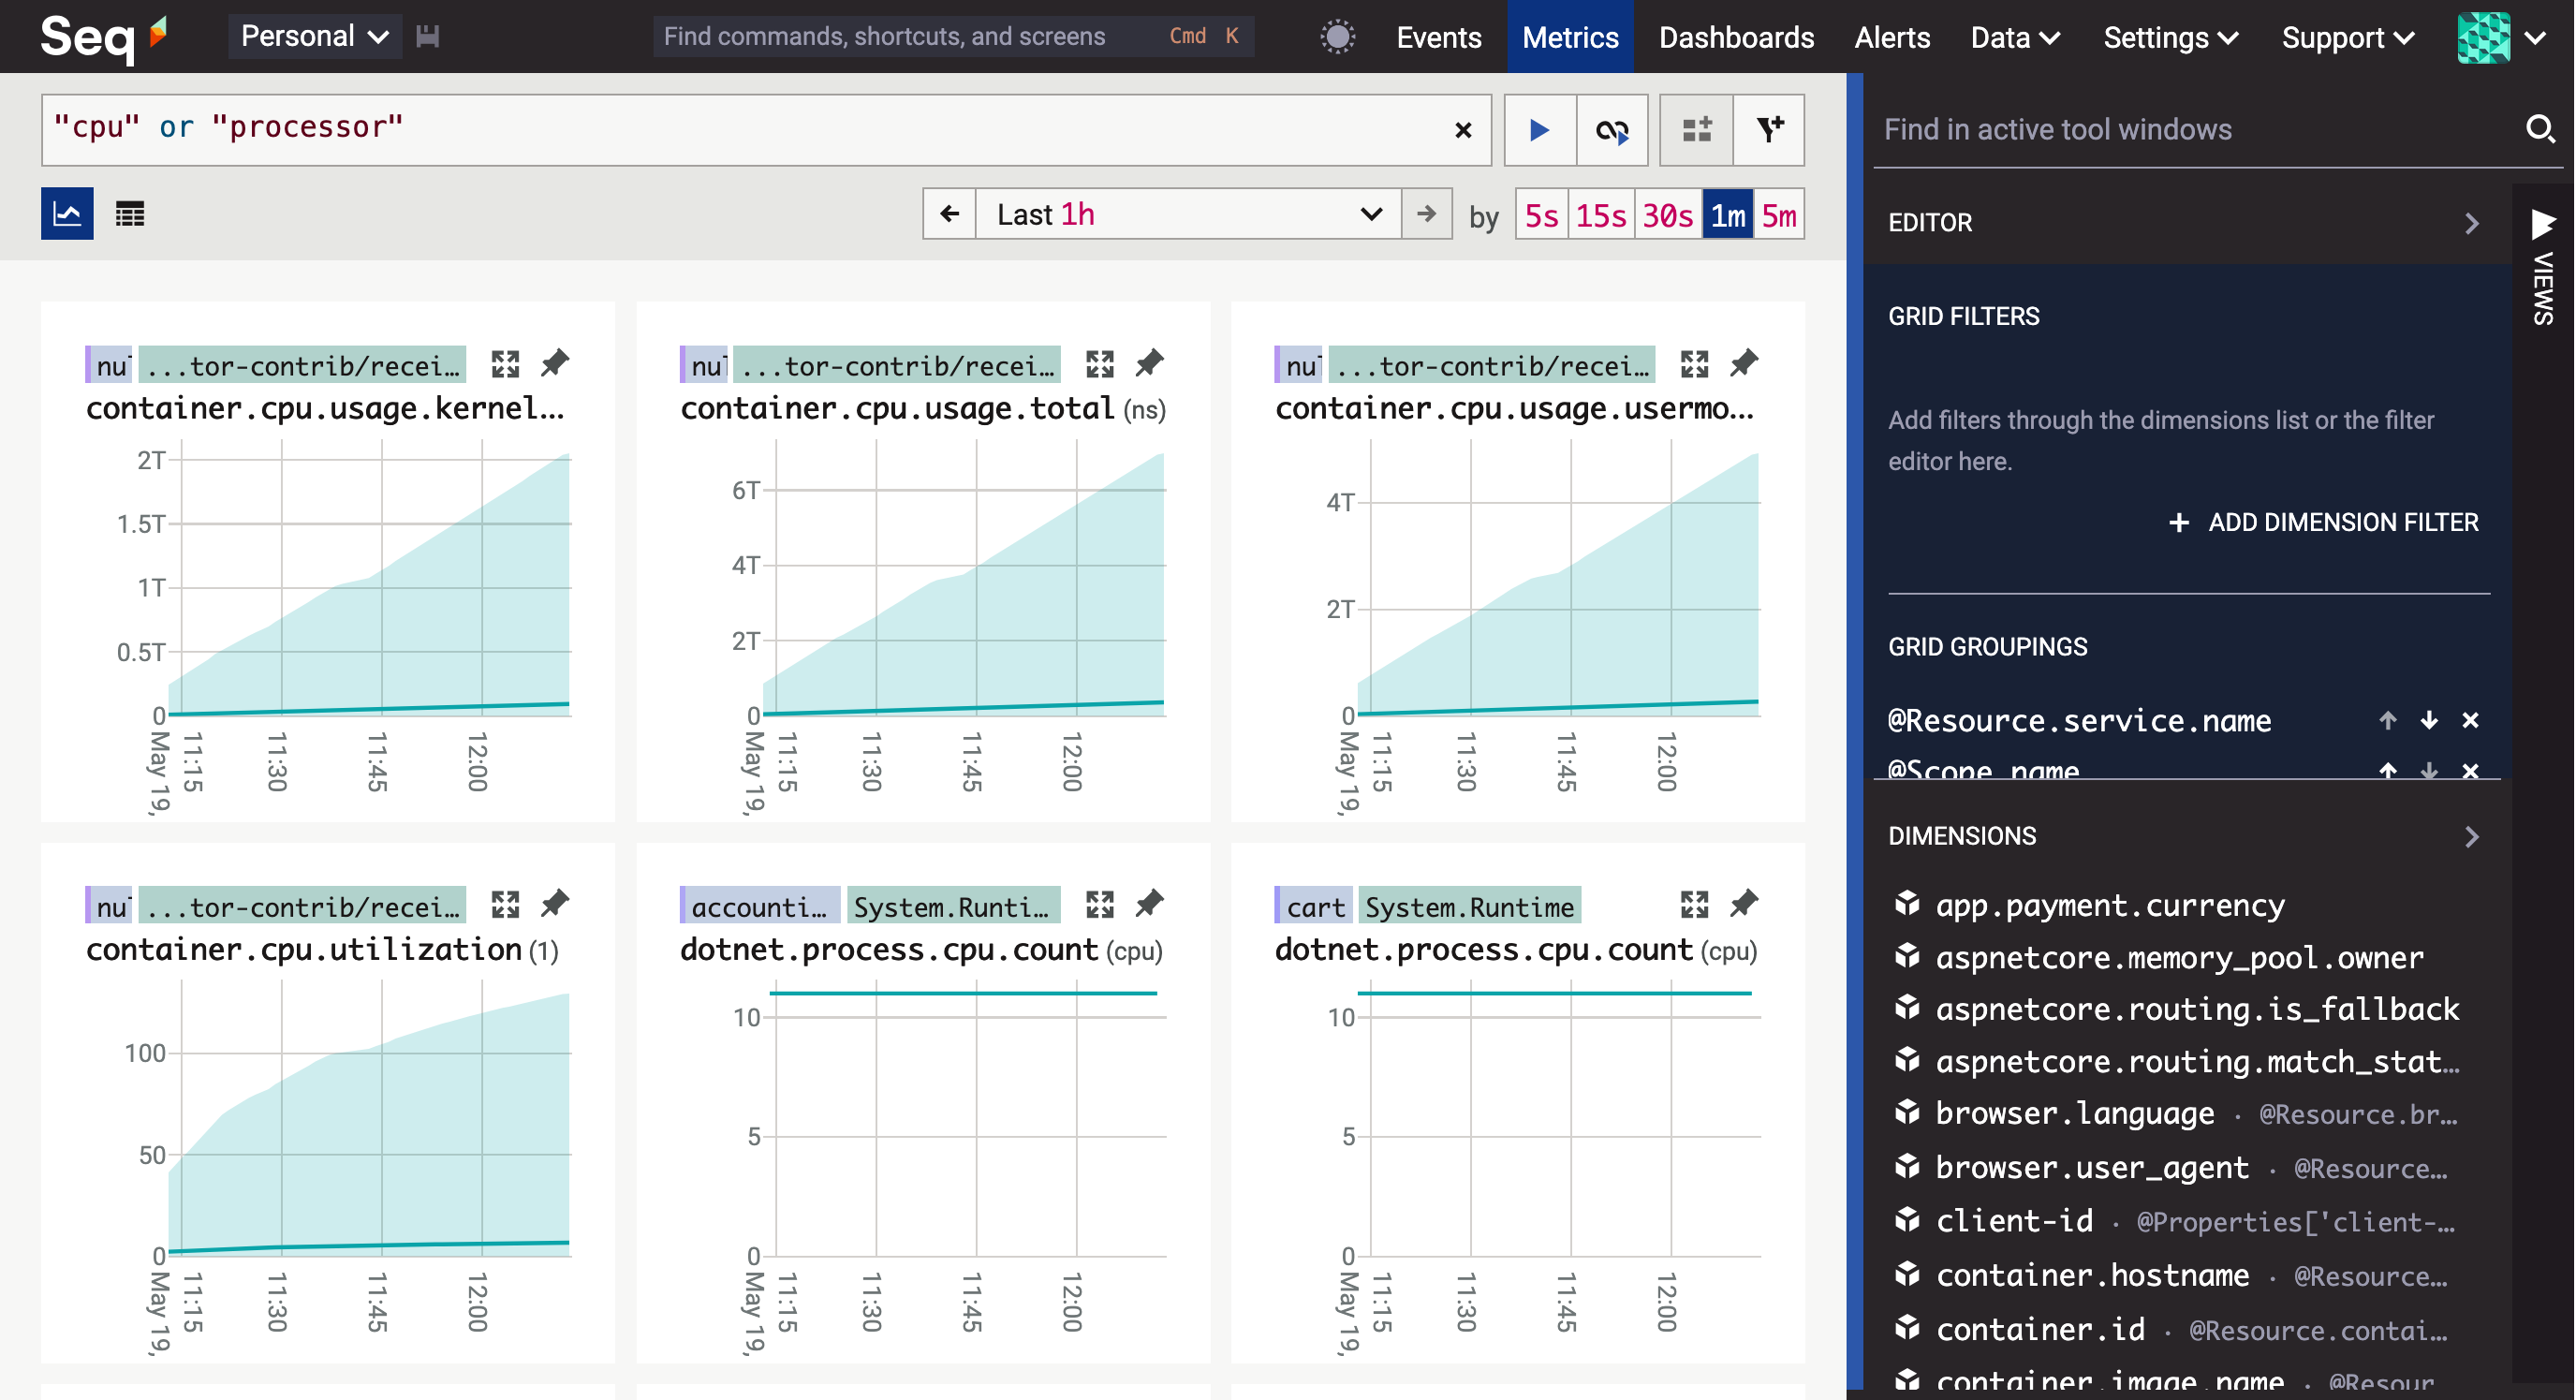
The search box at the top of the Metrics screen behaves very similarly to the one in Logs. Words and free text are interpreted as searches over metric names and descriptions:
Text terms can be combined using double quotes and logical connectives and, or, and not:
Expressions using the Seq query language are evaluated against the raw metric samples:
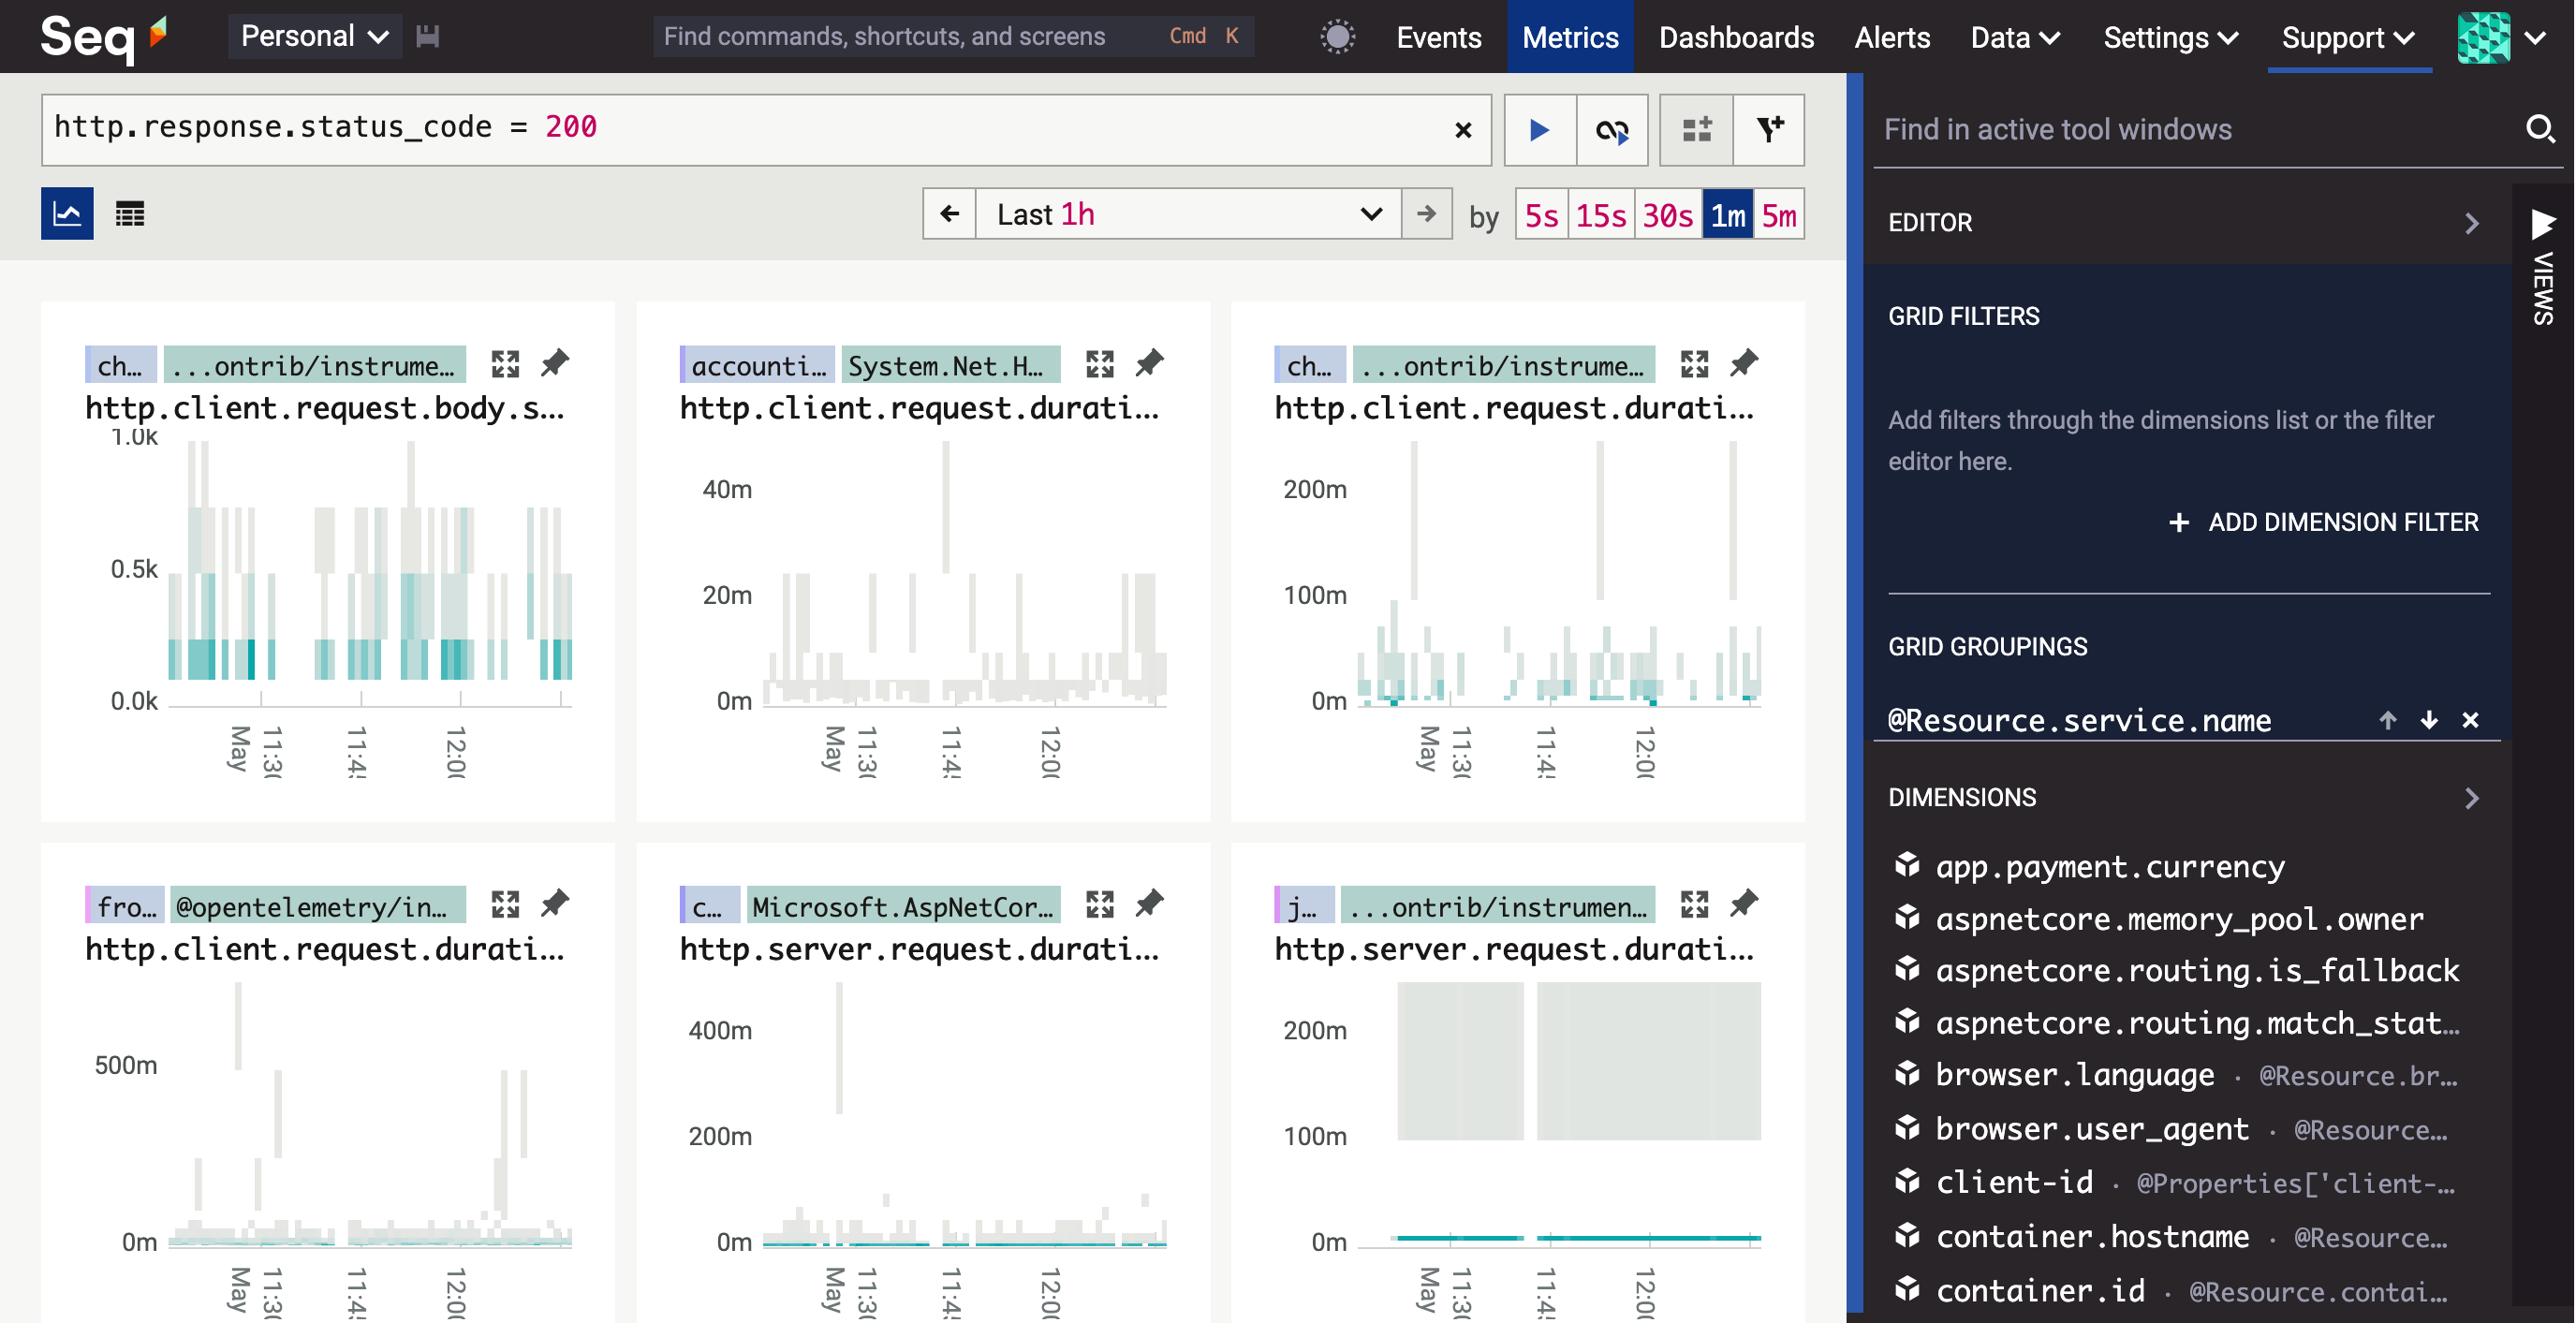
The property names used in expressions are the ones shown in the dimensions list, where it's also possible to see the values of key dimensions like @Resource.service.name and @Scope.name. You can zoom in on, or exclude, metrics carrying a particular dimension value by clicking that value in the dimensions list:
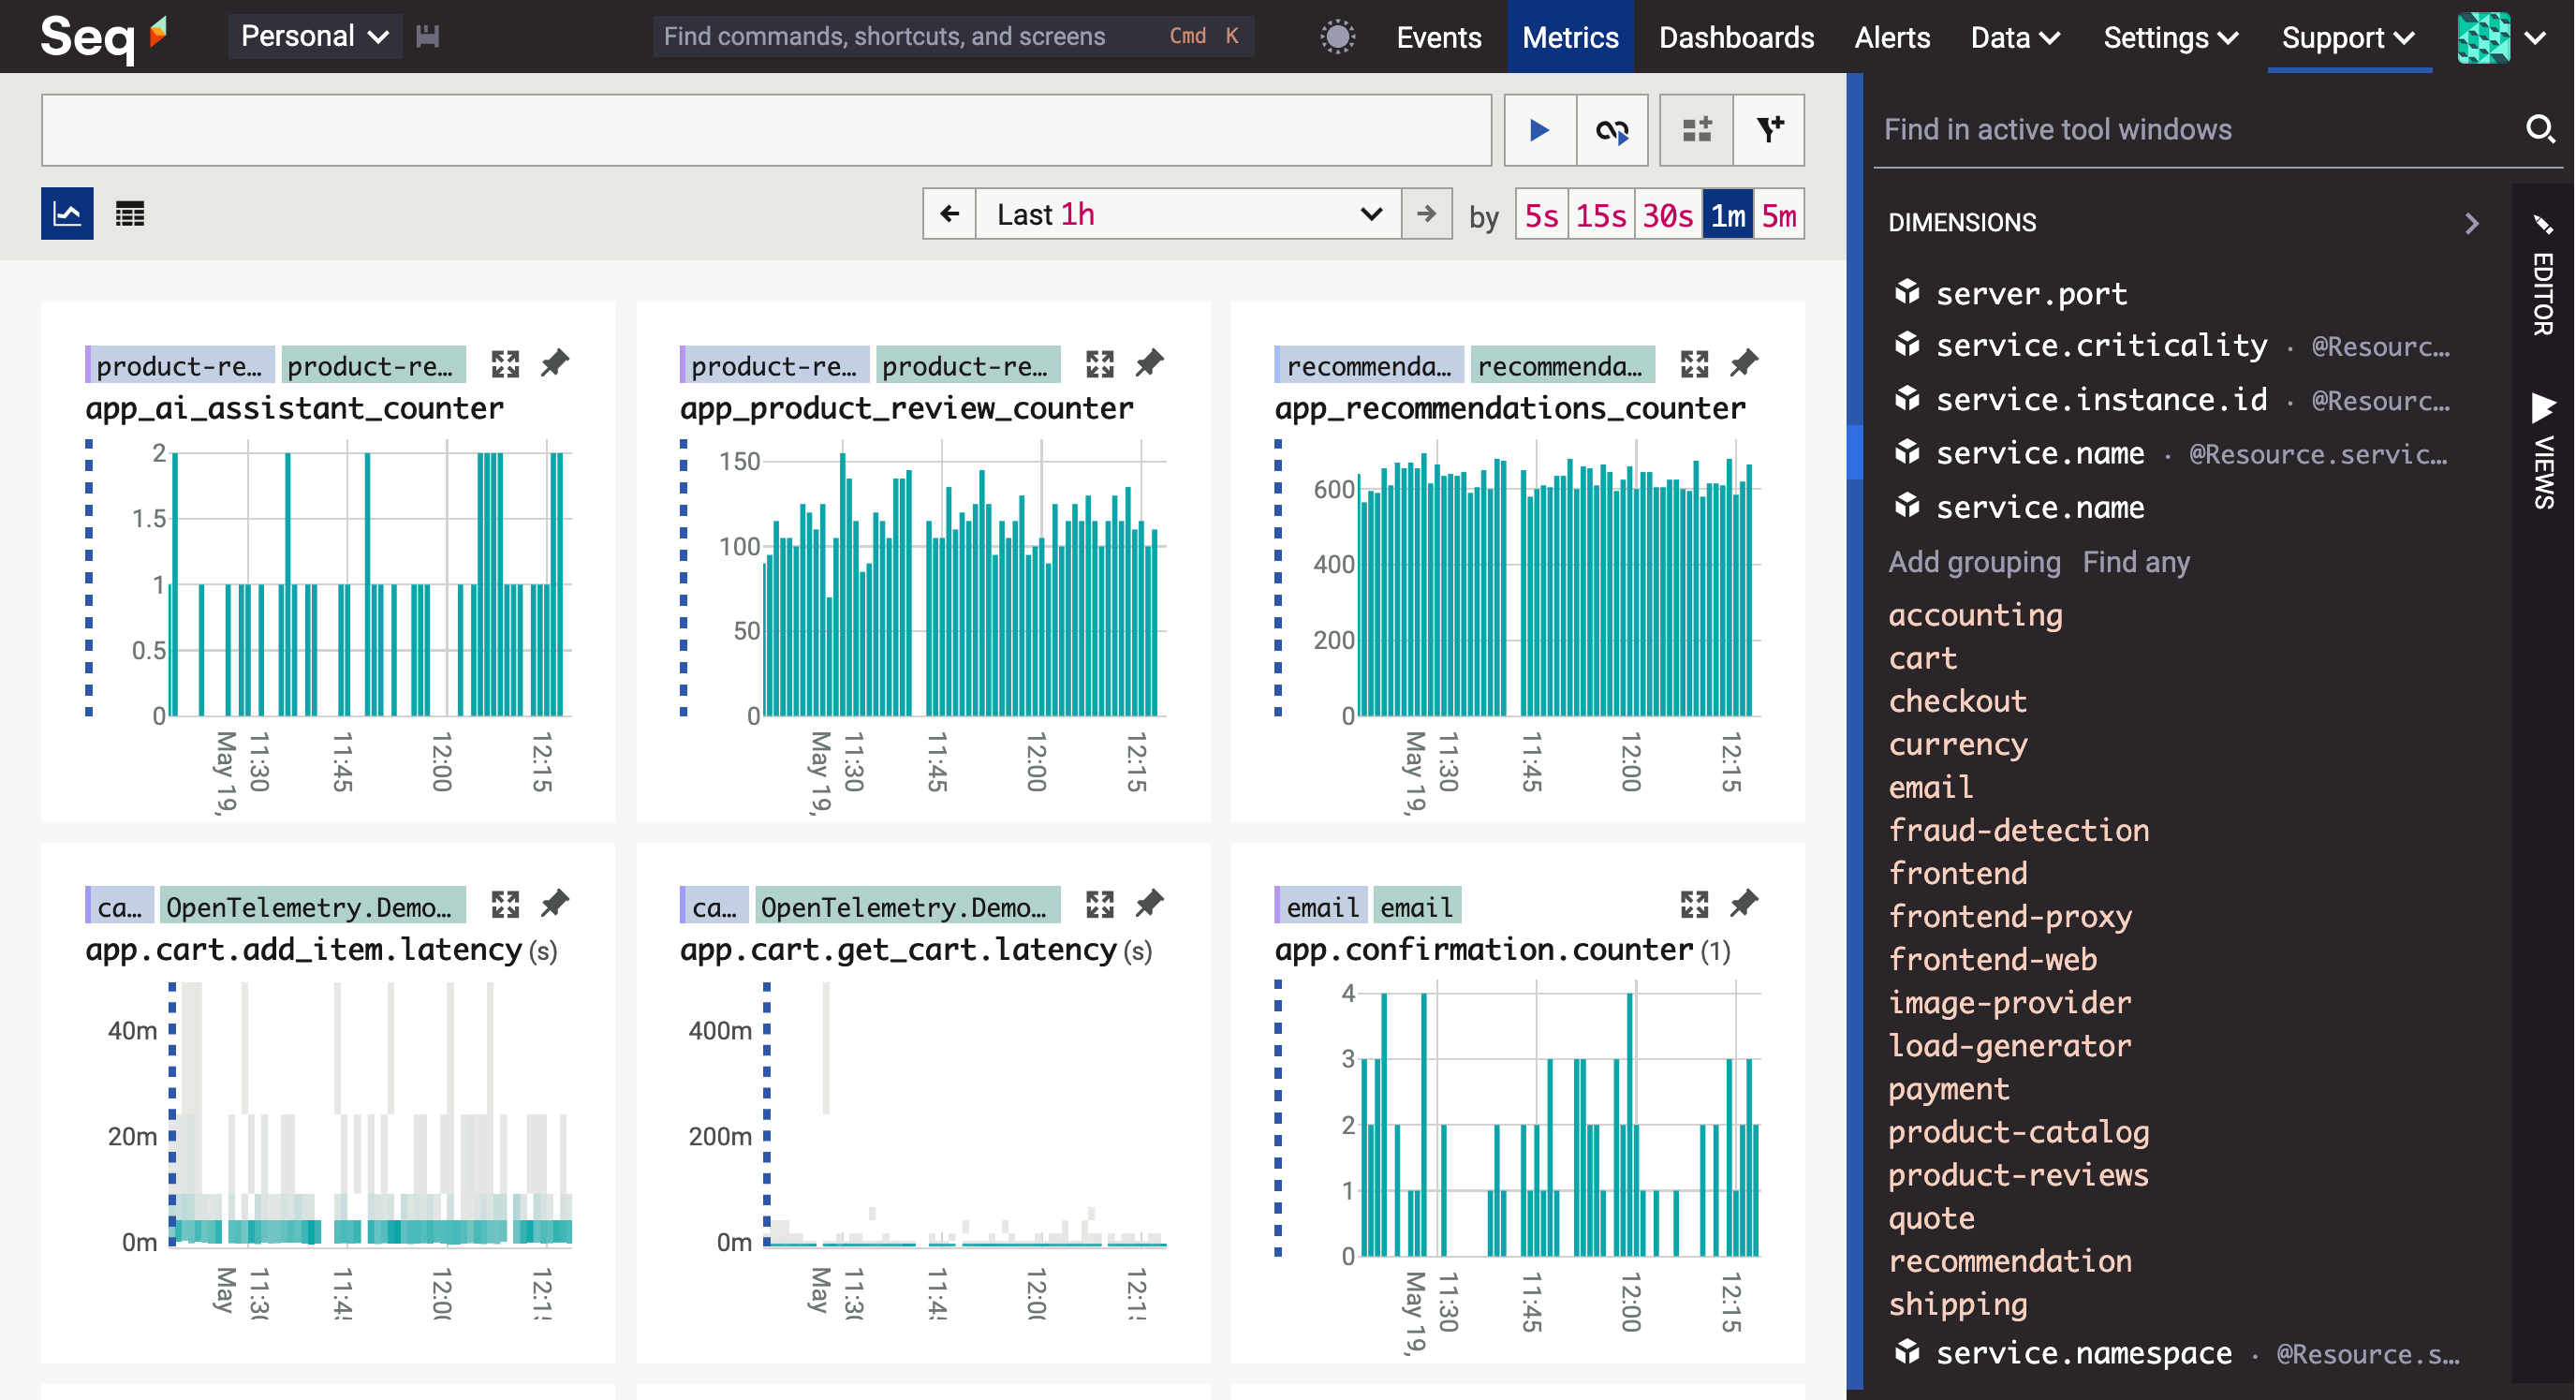
Filters created this way appear up in the view editor alongside the current groupings.
Press
Ctrl+Space Cto clear filters and groups, resetting the Metrics screen to its default view. PressCtrl+KorCmd+K(macOS) to see other shortcuts available in the Metrics screen.
Pin
As you search your way through available metrics, you'll find interesting ones that might have a bearing on the problem you're debugging or the component you need to monitor. Use the "tack" icon in the top right of the chart box to pin these metrics.
Scroll back up, and you'll see the pinned metrics arranged first in the grid.
Pinned metrics are "frozen", remembering the groups and filters that were active when the metric was pinned.
With an interesting set of charts shown, you can save your current view and return to it, complete with pinned metrics, groups, and filters, by clicking the save icon in the view editor.
Maximize
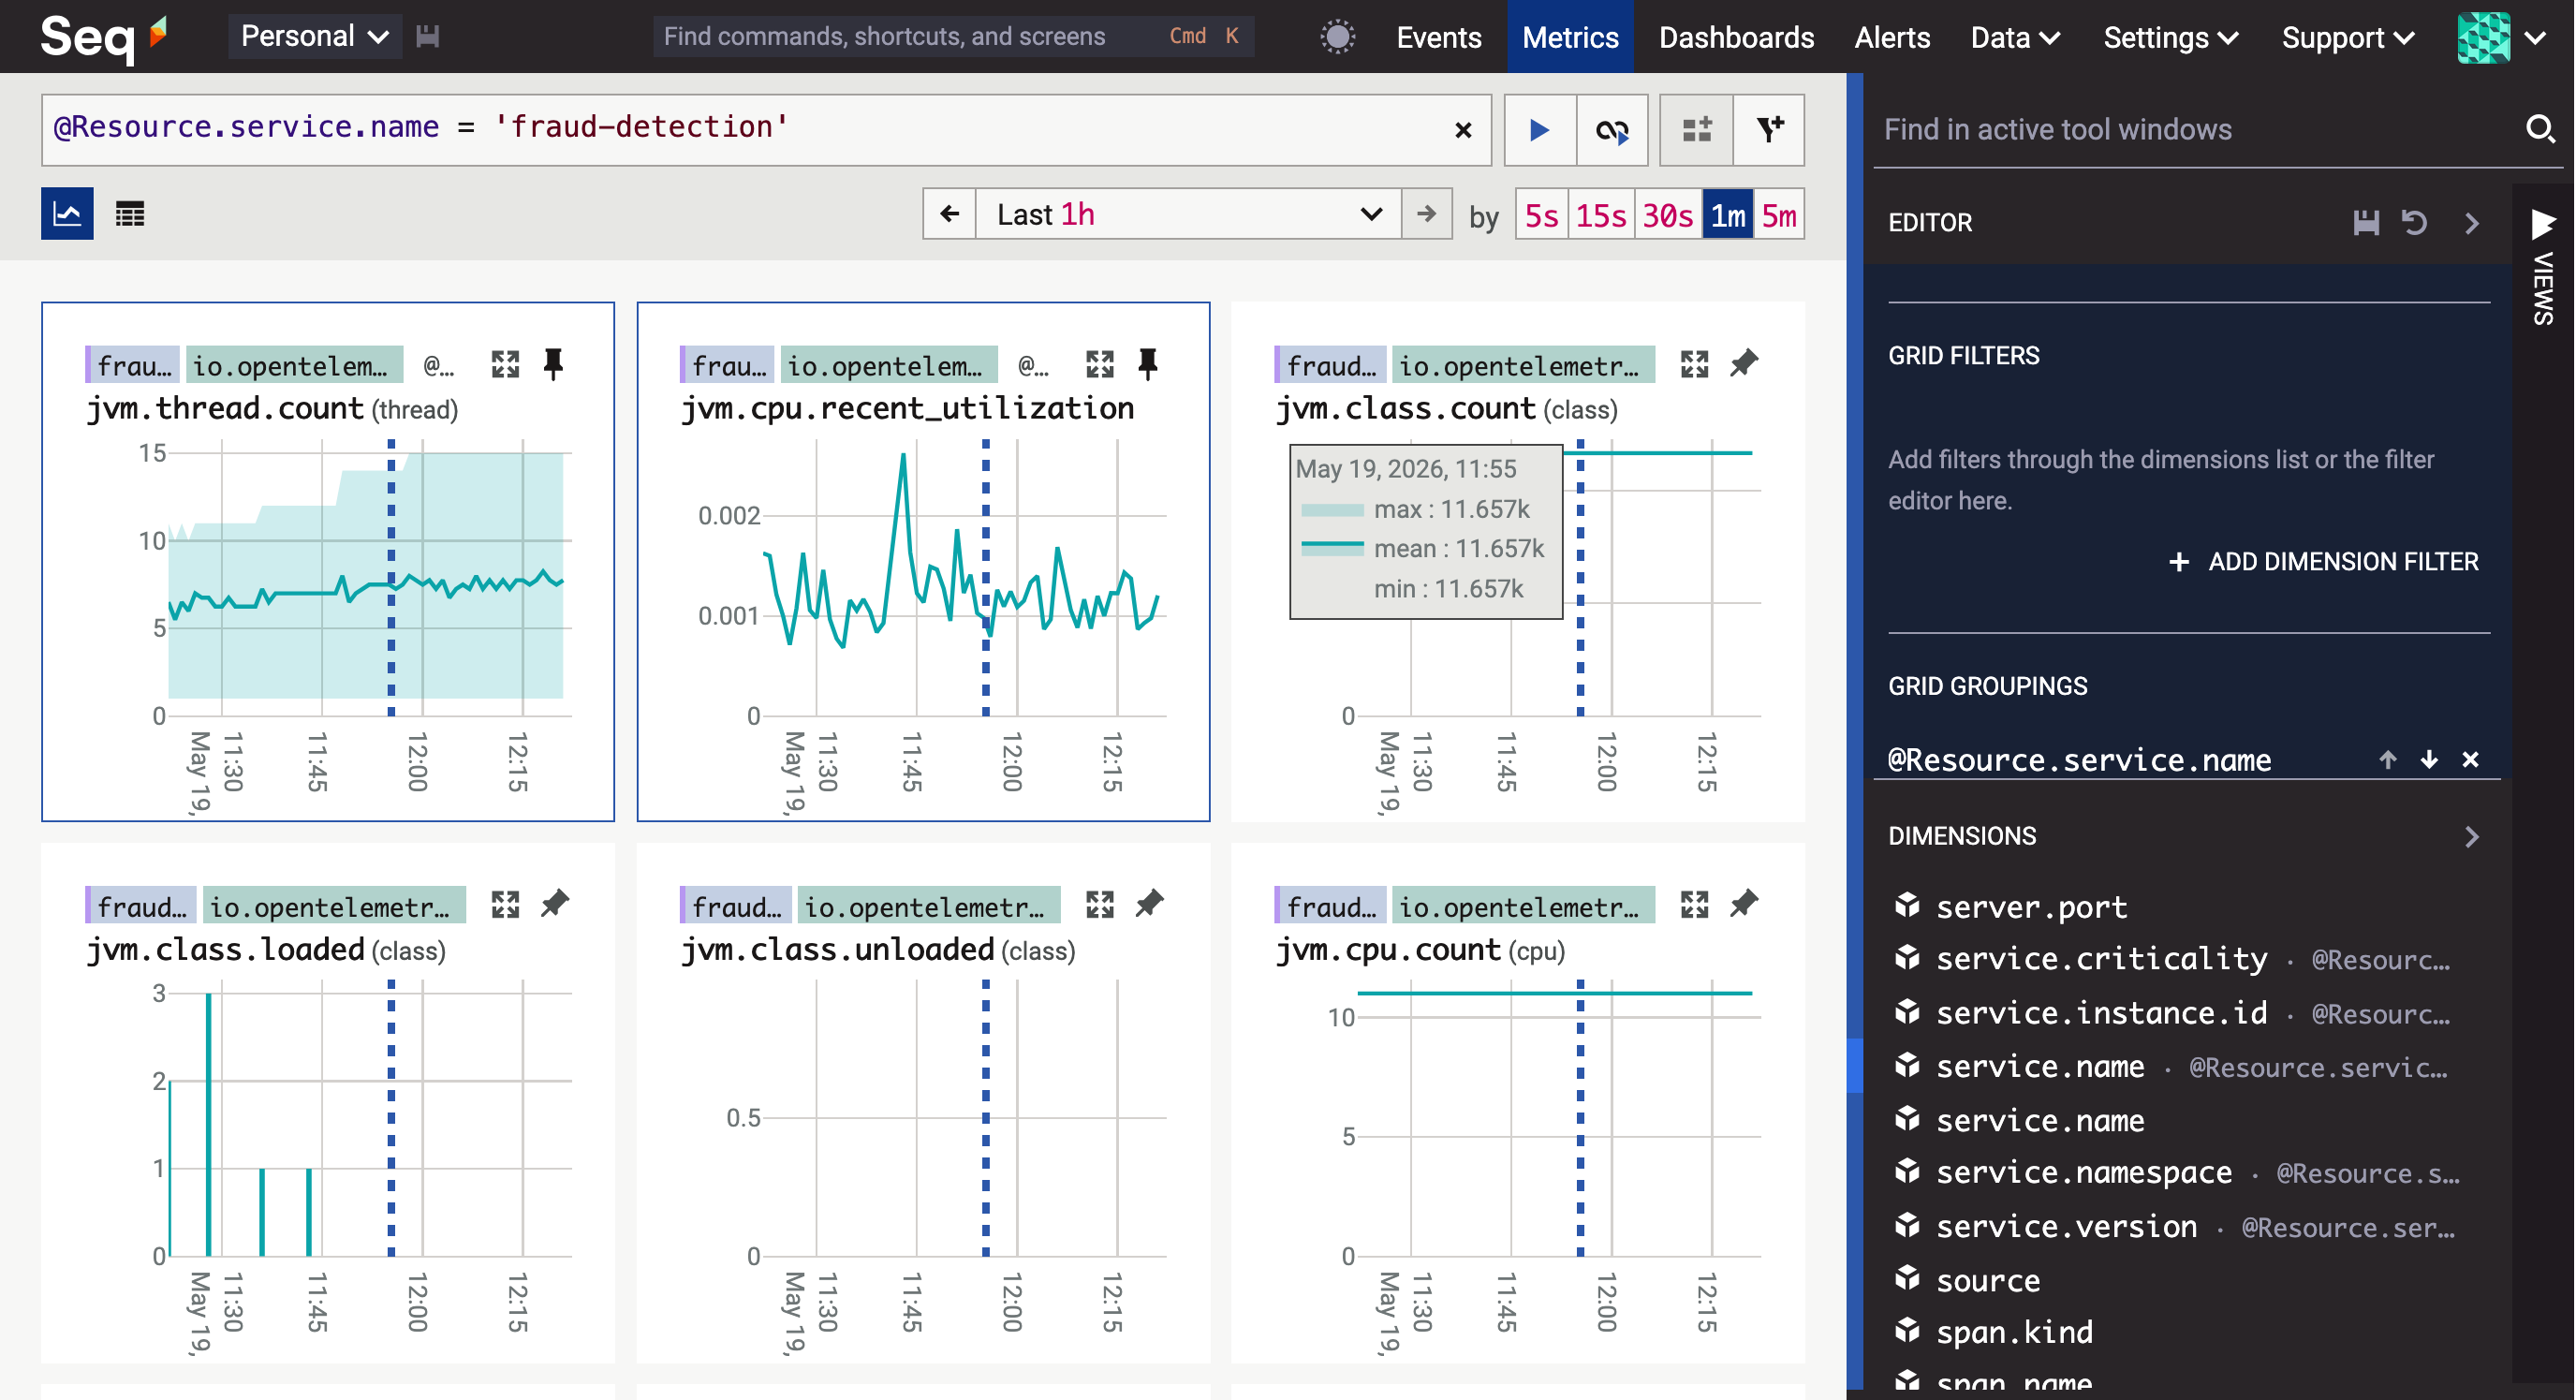
Beside the pin button is the maximize button. This zooms in on a single metric:
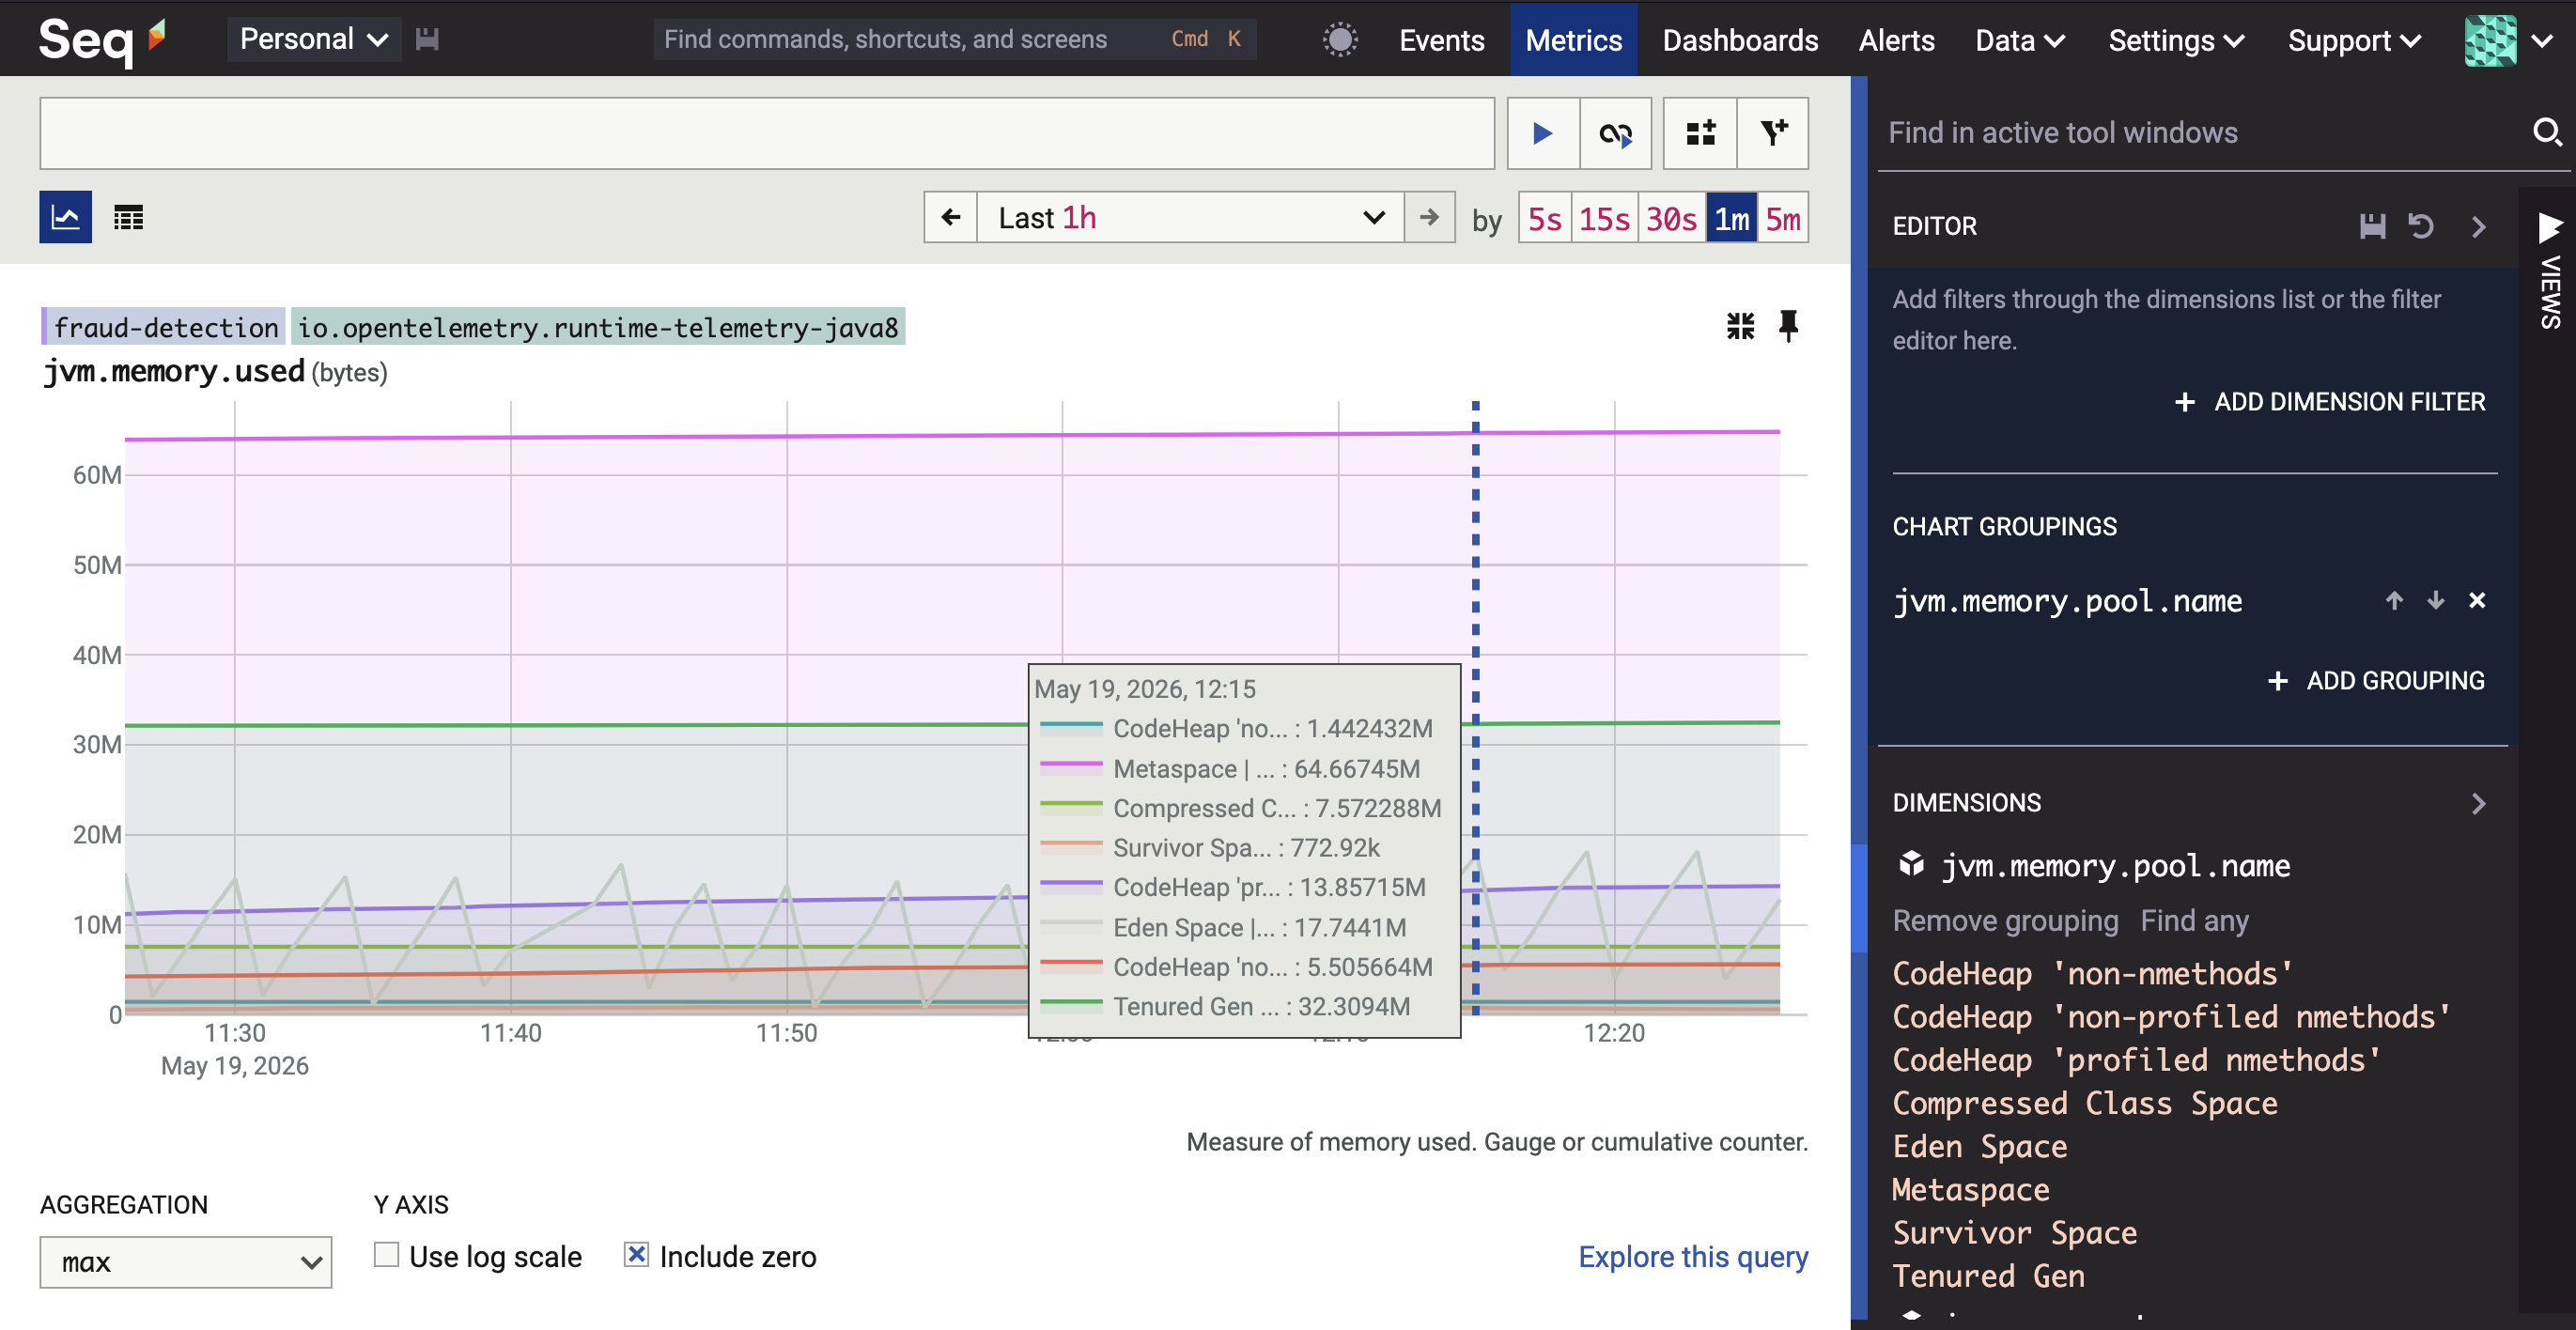
Here, you can do a few interesting things:
- Apply groupings and filters to the individual chart.
- See which dimensions apply to this particular metric.
- Adjust the aggregation and other display options applied to the chart. This will automatically pin the chart, and your display preferences will be saved along with the rest of the view.
- Quickly scrub back and forwards in time, showing just the maximized metric. This is quicker than refreshing the whole metric search when the time range changes.
- Add the chart to a dashboard, and in a near-future preview build, create alerts based on the metric. These buttons are to the right of the search box.
Retention policies for metrics
Metric data grows relentlessly. It's a good idea, right from the start, to set a retention time limit for metric data. You can do this in Data > Storage, choosing series (rather than stream) as the target for deletion.
Status
It's a great time to start instrumenting your applications with metrics in preparation for the Seq 2026.1 general availability (GA) release. The preview builds have some remaining feature gaps and rough edges, but they're solid enough for deployment in non-mission-critical, devlopment-level environments.
Your feedback is vital on the path to a Seq 2026.1 GA! Please reach out with your questions, bug reports, and suggestions for improvement either by emailing [email protected] or raising an issue or discussion on github.com/datalust/seq-tickets.