The upcoming Seq 2026.1 adds support for interactive debugging using OpenTelemetry metrics. Ingest metric data from any standard OTLP data source to view counters, gauges, and histograms, complete with all resource, scope, and (high-cardinality) point attributes.
Taking every opportunity to dogfood our own tools, this screenshot shows Seq's internal metrics, collected from our cluster test harness.
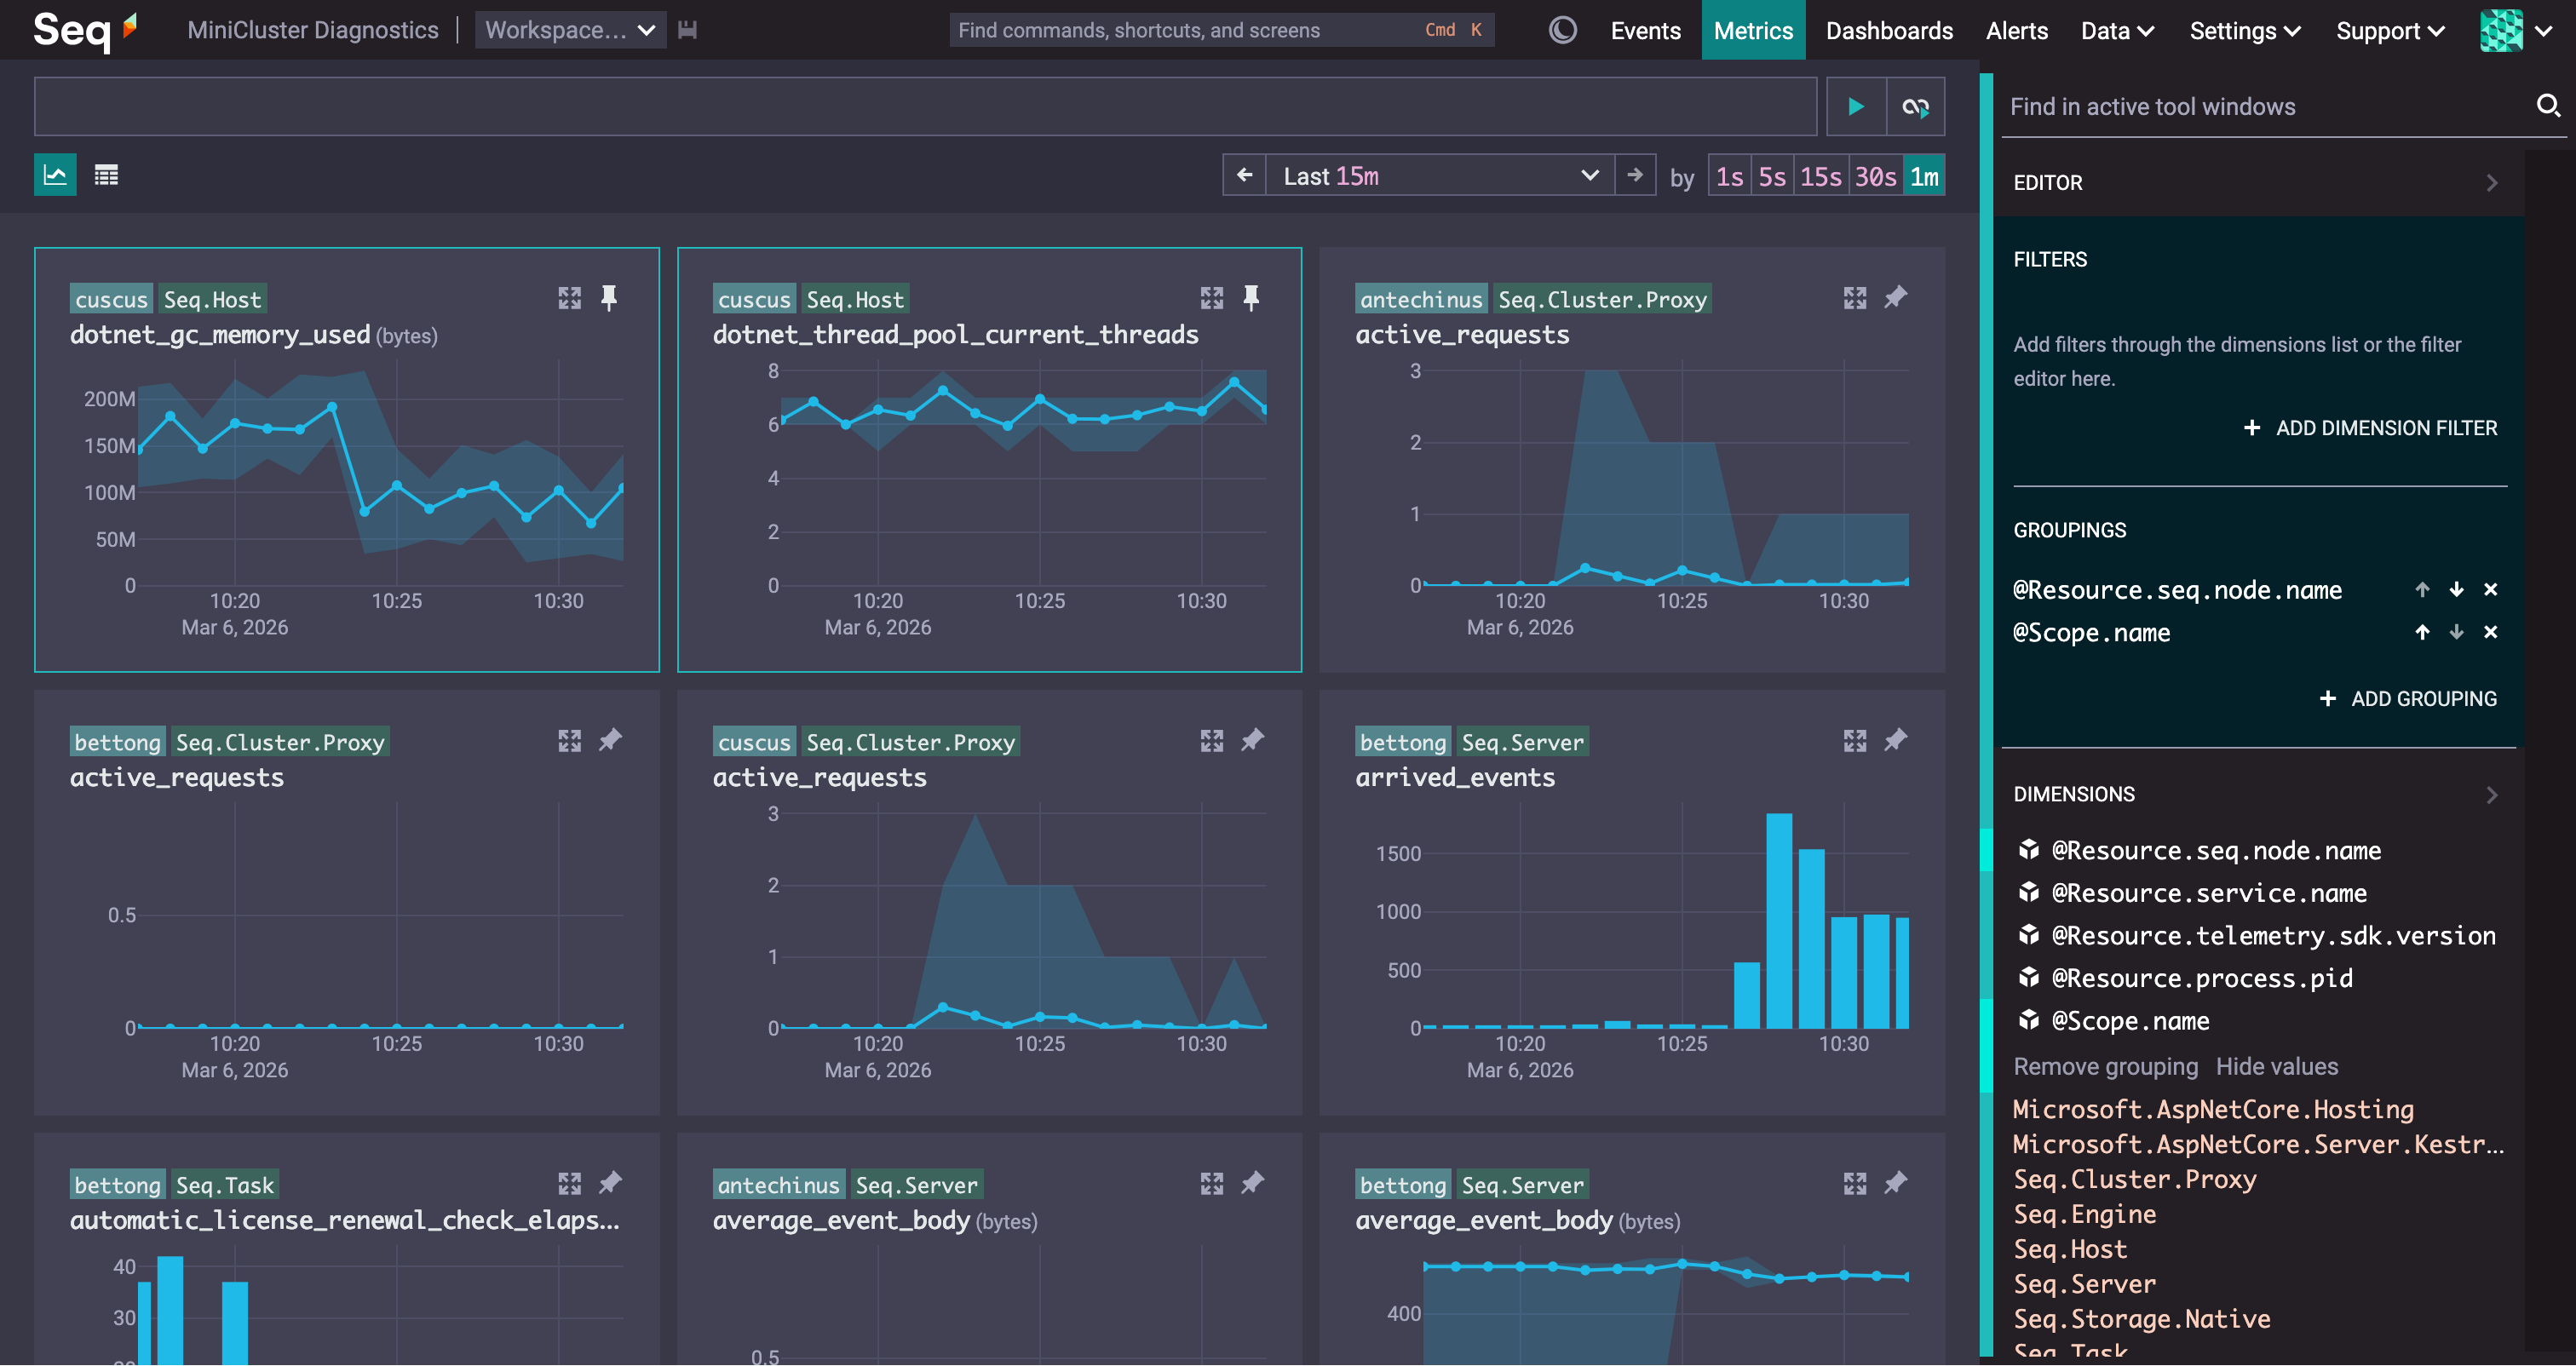
The Metrics screen is focused on interactive, real-time debugging with metrics. Debugging with metrics is a process of sifting through charts and looking for features that correlate with a system's observed behaviour.
Like Seq's Events screen, the initial view in the Metrics screen is of everything, and the flexible search box refines the charts you see. Text search runs over metric names and descriptions, and structured conditions are evaluated over fine-grained metric attributes.
Results are grouped by OpenTelemetry resource and scope by default, with one chart shown for each group. You can change this grouping to organize results around the dimensions relevant to the task at hand; in this case we're grouping by Seq cluster node along with @Scope.name.
When you've found an interesting chart, you can pin it to the top of the chart grid. This freezes the chart so it shows the same data while you continue exploring through different search conditions and groups. By progressively filtering, grouping, and pinning results, you can build up a view with just the information you need - all on one screen, all nicely correlated along the time axis.
If you're interested in access to the first "insiders" builds, or have existing metrics infrastructure you're planning to fold into your Seq install, reach out via [email protected] - we'd love to have you in the loop.