The Seq team has released Seq 2026.1. Seq is a fully self-hosted telemetry server that receives logs, traces, and metrics from applications, exposes them through interactive search and visualization, drives proactive alerting, and integrates with a broad range of automated operational tools.
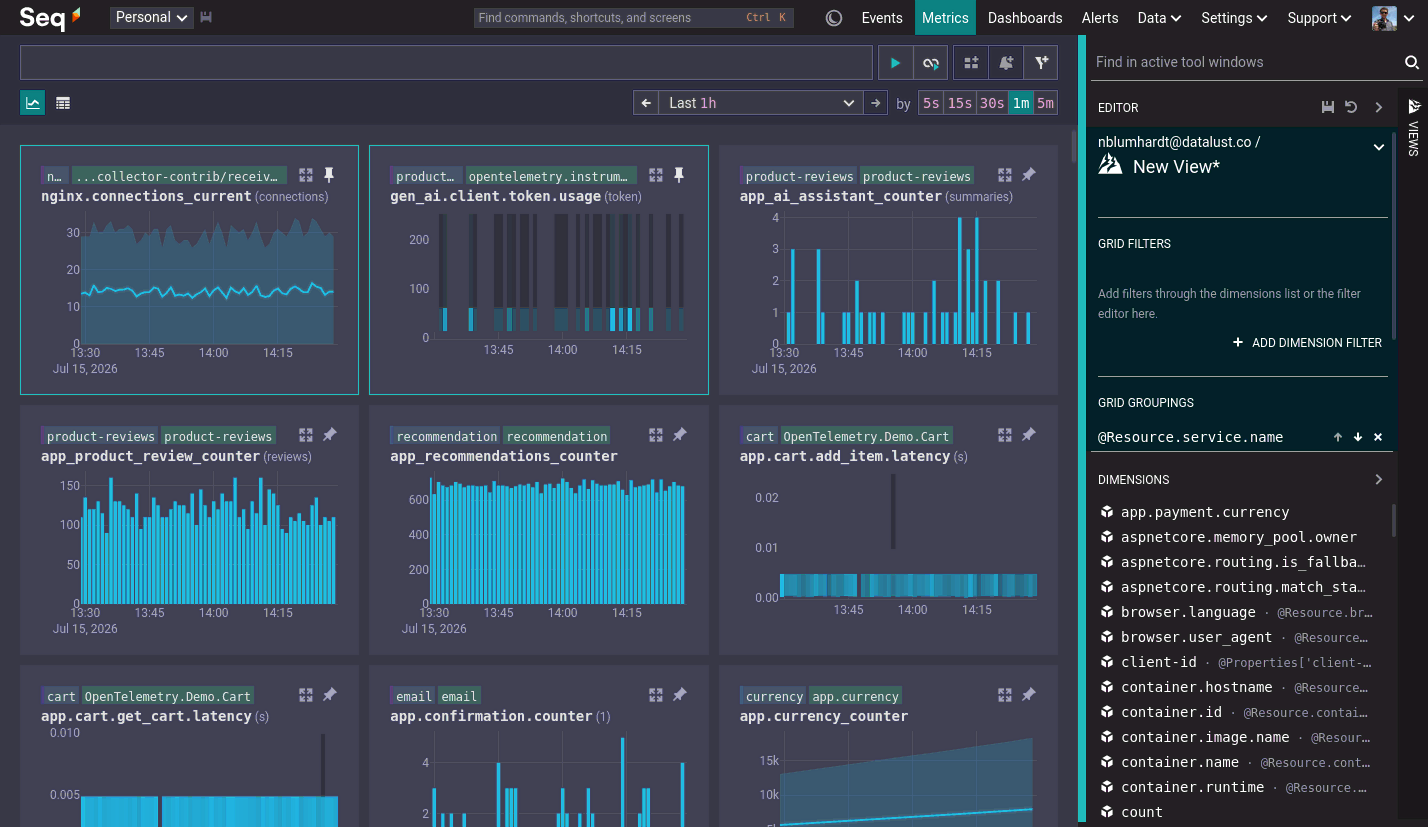
In this release, Seq gains OpenTelemetry metrics support with columnar data storage. This opens up a wide range of new monitoring and debugging capabilities, and provides a massive performance boost for analytical and dashboarding use cases.
Logs and traces aren't forgotten, either, with the new version making solid efficiency gains through a new on-disk compression format.
In conjunction with the 2026.1 release, we're also shipping a first-party MCP server for Seq, with accompanying skills, via the seqcli command-line client.
TL;DR: download Seq 2026.1 for Windows from datalust.co/download, or pull the latest
datalust/seqcontainer image from Docker Hub and AWS ECR.
OpenTelemetry Metrics
In the OpenTelemetry world, metrics are streams of timestamped numeric samples, with metadata attached. Think: CPU utilization, data throughput, request timings, error rates. Applications and libraries define their own domain-specific metrics: coffees served, roaster temperature, order dispatch time, ... really, anything at all that can be recorded as a number and a timestamp.
The information recorded in metrics could arguably be represented in structured logs or trace spans. Each additional, overlapping, observability signal does add some complexity - but even so, metrics are highly compelling, for three reasons:
- Performance
- Discoverabilty
- Ubiquity
First, performance. Numeric data following predictable patterns compresses extremely well, and many metric processing algorithms work directly on compressed or partially-compressed data. Using a metric counter to record the number of coffees served in the Seq Café might use 10, 100, or even 1000 times less on-disk space than a typical "Served another coffee!" log event. Reduced on-disk footprint means less I/O, and significantly less processing at query time.
Seq 2026.1 uses a new columnar storage engine, hand-written in Rust, to store and query compressed metric data. The Metrics screen, and dashboard charts over metric series, can present results in a fraction of the time required for similar numeric aggregations over row-oriented log or trace data.
Second, discovery. Numeric information attached to log events or trace spans can't be usefully charted without additional information describing what the numbers mean. Metrics address this by catergorizing samples as counters (sums), point-in-time values (gauges), and so-on, so that meaningful aggregating functions can be used to chart them. Metric samples also carry unit-of-measure information, and free-text descriptions, to aid interpretation.
Seq 2026.1 takes full advantage of this information to present metrics in an easy-to-read tiled chart view. Zero additional configuration is required to go from metric sample data to useful, fully-interactive charting. This makes first-class metrics a much more useful exploratory and investigative tool than raw numeric values in log events or spans.
Third, ubiquity. Metrics are everywhere. In recent years, metrics have been embraced alongside logs and traces as standard diagnostic outputs for libraries, frameworks, and applications. Whether it's the .NET runtime, an agentic coding harness like Claude Code, or a web server built with Go's net/http, chances are, OTLP metrics are available either in the box, or trivially enabled using add-on packages like the OTel SDK.
Seq 2026.1 implements standard OTLP metric ingestion, and aside from configuring the sender with Seq's OTLP ingestion endpoint, nothing else is required to take advantage of practically any existing source of metric data.
Getting Metrics into Seq
This "hello world" example uses the OpenTelemetry .NET SDK. To follow along, either install the Seq MSI (Windows), or start a Seq 2026.1 container:
docker pull datalust/seq
docker run \
    --name seq \
    -d \
    -p 5341:80 \
    -e ACCEPT_EULA=Y \
    -e SEQ_PASSWORD=YourPassw0rd! \
    datalust/seq
Log in at http://localhost:5341 using admin and the password you specified (YourPassw0rd! in the example).
Create a new .NET 10 console application and install some NuGet packages:
mkdir ./hello-metrics
cd ./hello-metrics
dotnet new console
dotnet add package OpenTelemetry.Exporter.OpenTelemetryProtocol
Here's Program.cs:
using System.Diagnostics.Metrics;
using OpenTelemetry;
using OpenTelemetry.Exporter;
using OpenTelemetry.Metrics;
using OpenTelemetry.Resources;

var meter = new Meter("Example.Hello");
var loopCounter = meter.CreateCounter<int>(
    "hello.loop",
    unit: "{loops}",
    description: "The number of times the example loop has run.");

using var meterProvider = Sdk.CreateMeterProviderBuilder()
    .SetResourceBuilder(ResourceBuilder.CreateDefault().AddService("hello-metrics"))
    .AddMeter(meter.Name)
    .AddOtlpExporter((exporter, reader) =>
    {
        exporter.Protocol = OtlpExportProtocol.HttpProtobuf;
        exporter.Endpoint = new Uri("http://localhost:5341/ingest/otlp/v1/metrics");

        reader.TemporalityPreference = MetricReaderTemporalityPreference.Delta;

        // In production, accept the SDK defaults here.
        reader.PeriodicExportingMetricReaderOptions.ExportIntervalMilliseconds = 5000;
    })
    .Build();

while (true)
{
    loopCounter.Add(1);
    await Task.Delay(100);
}
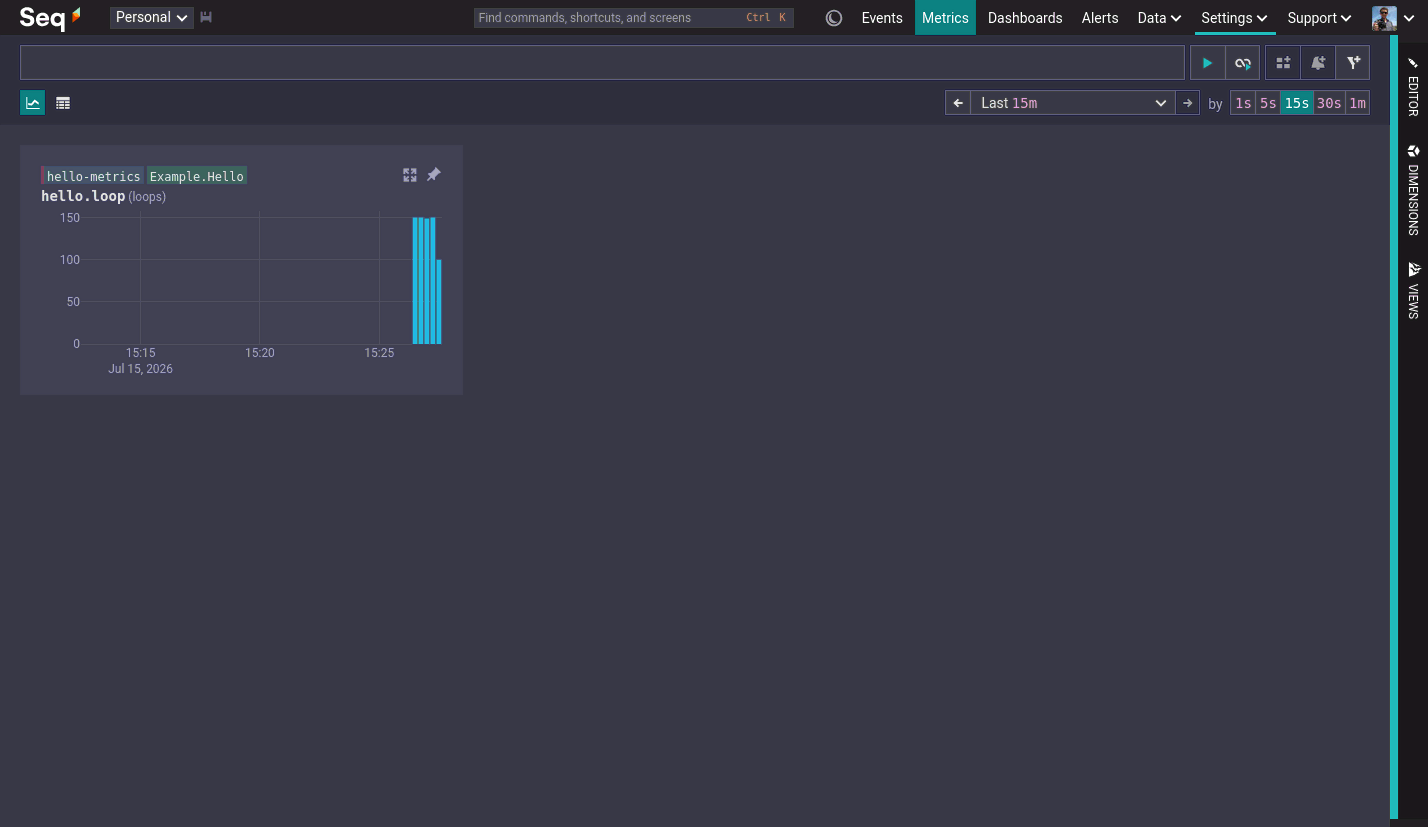
The example defines a counter called hello.loop, and increments it every 100 milliseconds. The count is sampled every five seconds.
Run the example with:
dotnet run
In Seq, navigating to the Metrics screen shows the rate of counter increments.
Metrics are really easy to use, but we have a few important tips for success:
- Make sure your metric sources are configured with delta aggregation temporality (counters won't look right otherwise!)
- When recording metrics, don't over-sample. 30-60s is adequate for most purposes, and still generates a lot of points across multiple metrics, services, and application/container instances.
- Metrics ingestion imposes a hard 10-minute arrival window. Late samples are dropped.
What about Prometheus endpoints? We've extended Seq's pluggable inputs to support what's needed for a plug-in Prometheus endpoint scraper. If you're interested in sending Prometheus-style metrics to Seq, please chime in on this ticket.
The Metrics Screen
The core interactions supported by the Metrics screen are group, search, pin, and maximize. Let's dig into how these work.
Group
When you open Metrics you'll see a grid of charts tagged with service and scope names. If multiple services report the same metric, say, http.request.duration, you'll see a chart of request durations for each individual service. If multiple different scopes (frameworks or libraries) within a service are reporting the metric, you'll also see a breakdown per scope. These keys, @Resource.service.name and @Scope.name, are the default "grouping", and you can see this in the right-hand-side view editor.
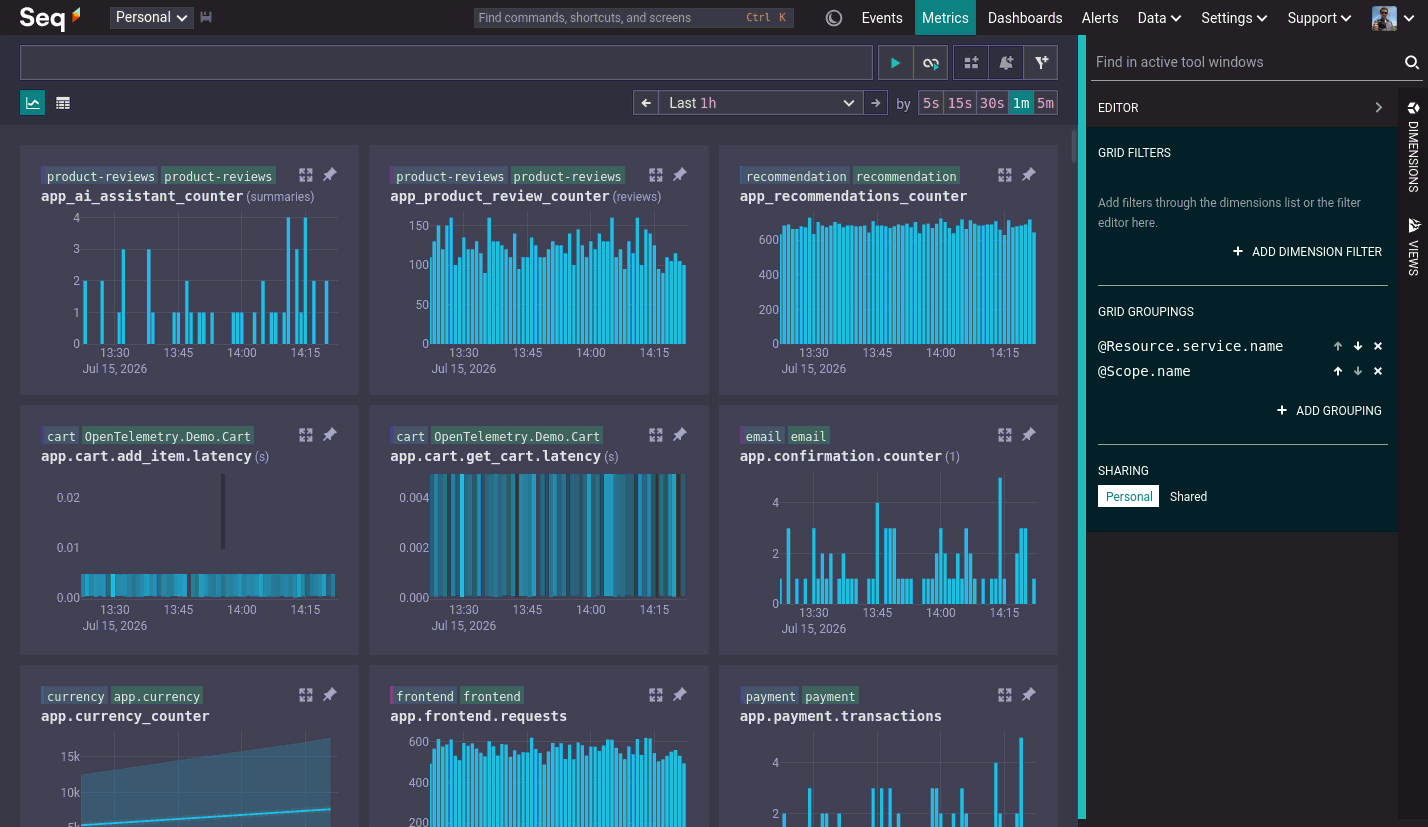
The best grouping will often depend on the task. You can change the grouping in the view editor directly, or by searching the dimensions list and selecting Group after clicking on a dimension name.
Want to see more charts per row? Click the small chart view button just below the search box.
Search
The search box at the top of the Metrics screen behaves very similarly to the one in Logs. Words and free text are interpreted as searches over metric names and descriptions:
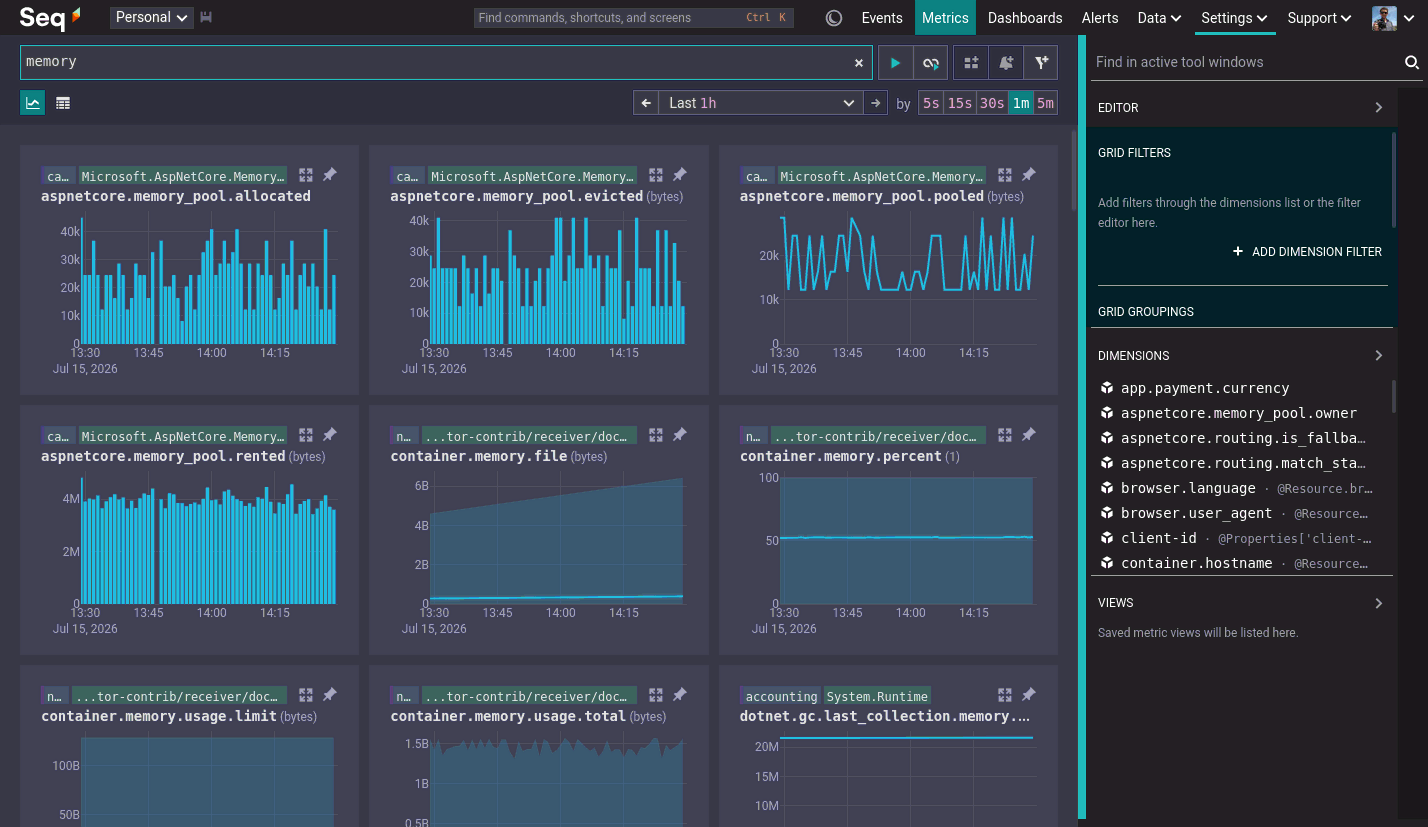
Text terms can be combined using double quotes and logical connectives and, or, and not:
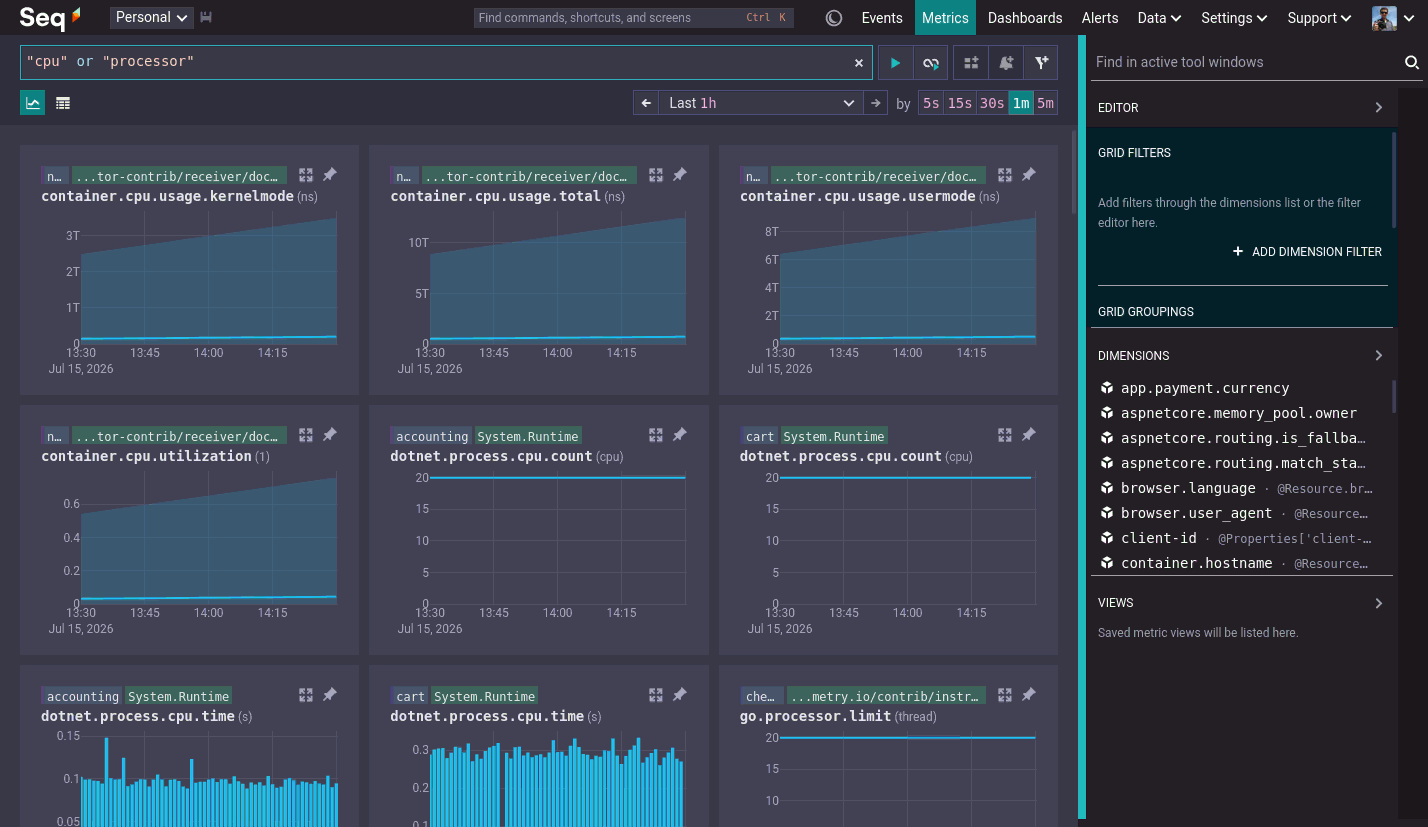
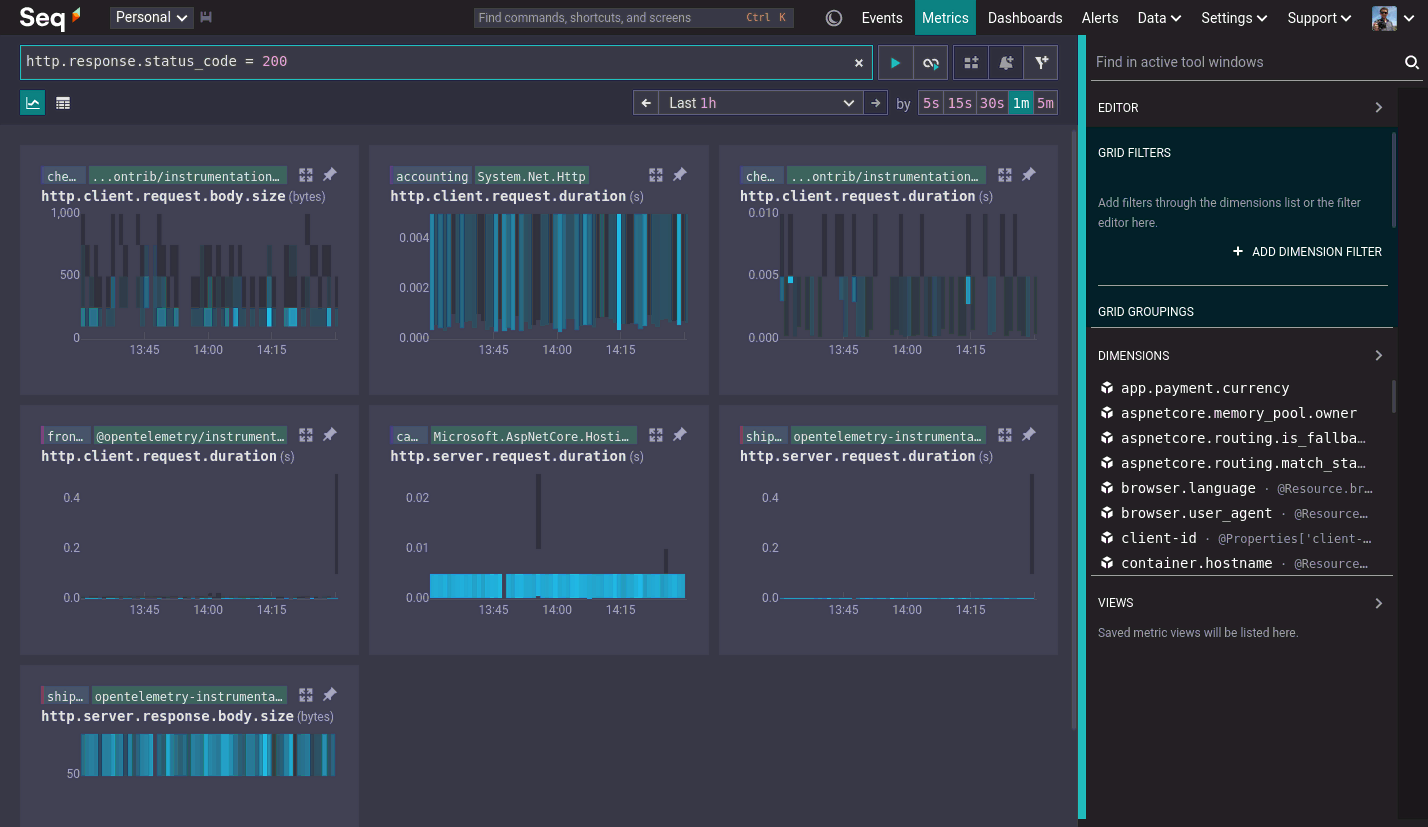
Expressions using the Seq query language are evaluated against the raw metric samples:
The property names used in expressions are the ones shown in the dimensions list, where it's also possible to see the values of dimensions like @Resource.service.name and @Scope.name. You can zoom in on, or exclude, metrics carrying a particular dimension value by clicking that value in the dimensions list:
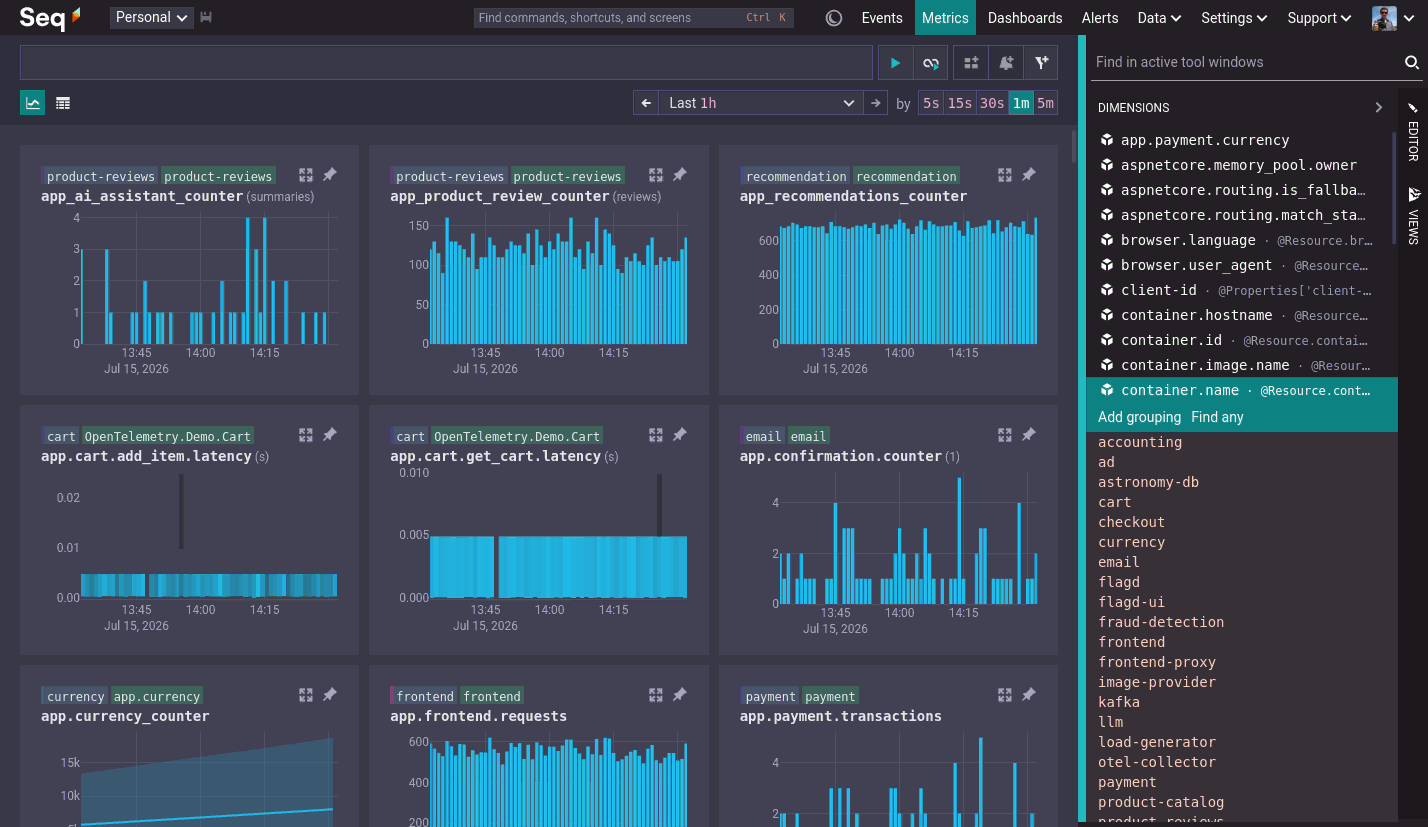
Filters created this way appear up in the view editor alongside the current groupings.
Press
Ctrl+Space Cto clear filters and groups, resetting the Metrics screen to its default view. PressCtrl+KorCmd+K(macOS) to see other shortcuts available in the Metrics screen.
Pin
As you search your way through available metrics, you'll find interesting ones that might have a bearing on the problem you're debugging or the component you need to monitor. Use the "tack" icon in the top right of the chart box to pin these metrics.
Scroll back up, and you'll see the pinned metrics arranged first in the grid.
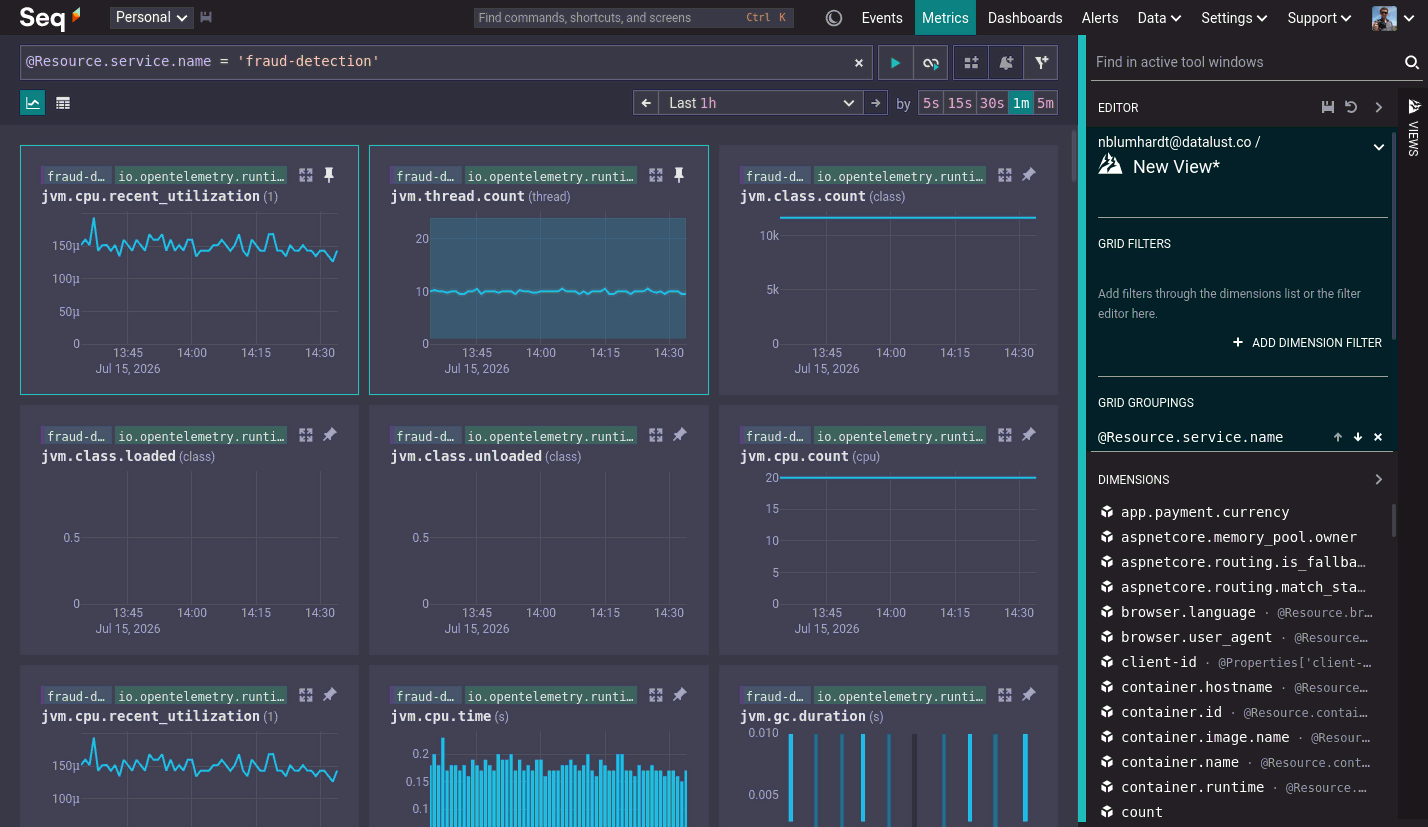
Pinned metrics are "frozen", remembering the groups and filters that were active when the metric was pinned.
With an interesting set of charts shown, you can save your current view and return to it, complete with pinned metrics, groups, and filters, by clicking the save icon in the view editor.
Maximize
Beside the pin button is the maximize button. This zooms in on a single metric:
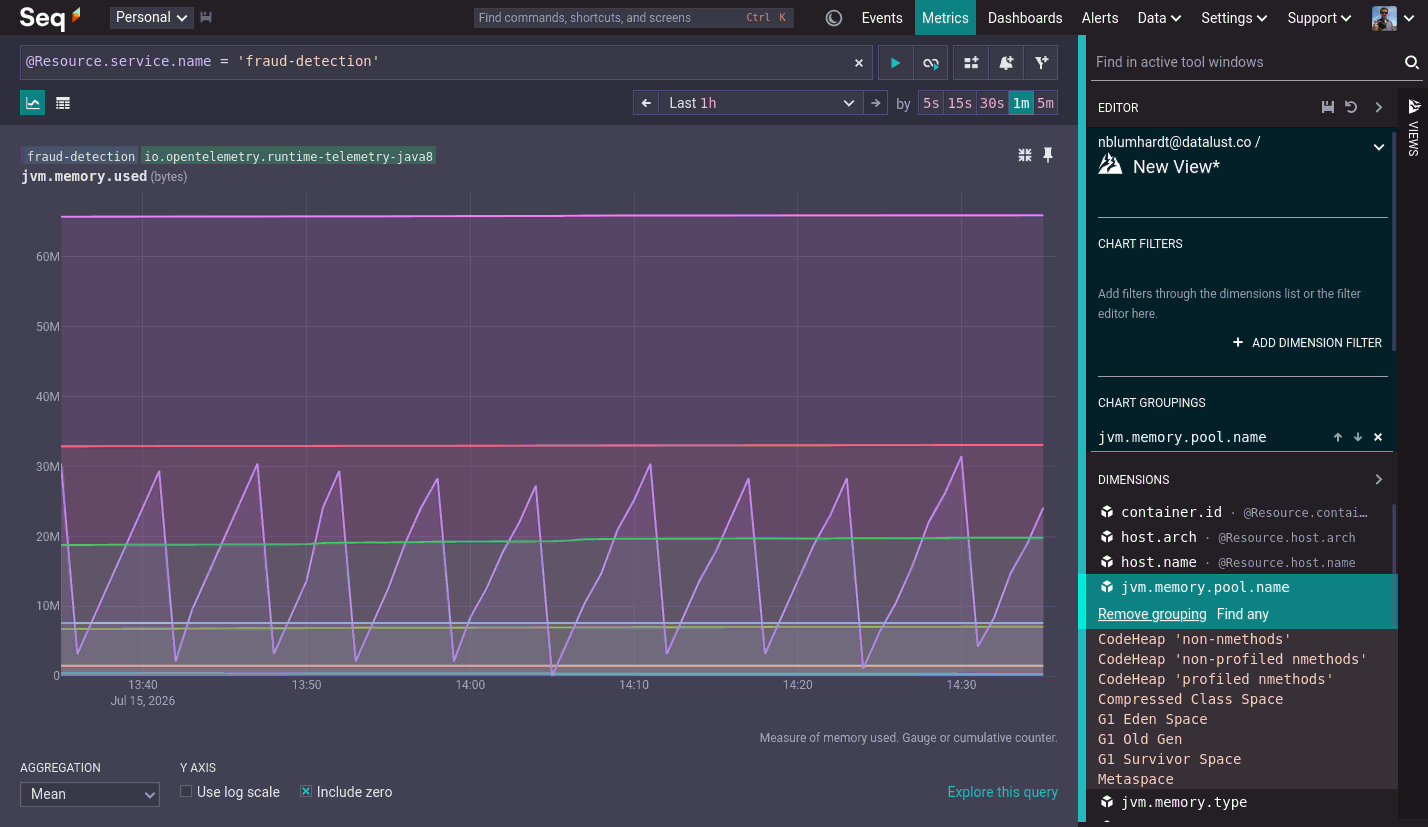
Here, you can do a few interesting things:
- Apply groupings and filters to the individual chart.
- See which dimensions apply to this particular metric.
- Adjust the aggregation and other display options applied to the chart. This automatically pins the chart, and your display preferences will be saved along with the rest of the view.
- Quickly scrub back and forwards in time, showing just the maximized metric. This is much more efficient than navigating in the grid view.
- Add the chart to a dashboard, and create alerts based on the metric. These buttons are to the right of the search box.
Retention Policies for Metrics
It's a good idea, right from the start, to set a retention time limit for metric data. You can do this in Data > Storage, choosing series (rather than stream) as the target for deletion.
Improved Log and Trace Compression
In row-oriented storage, Seq 2026.1 compresses newly-written data using a fast and efficient dictionary compression scheme utilizing a tokenizer that's customized for log events and traces.
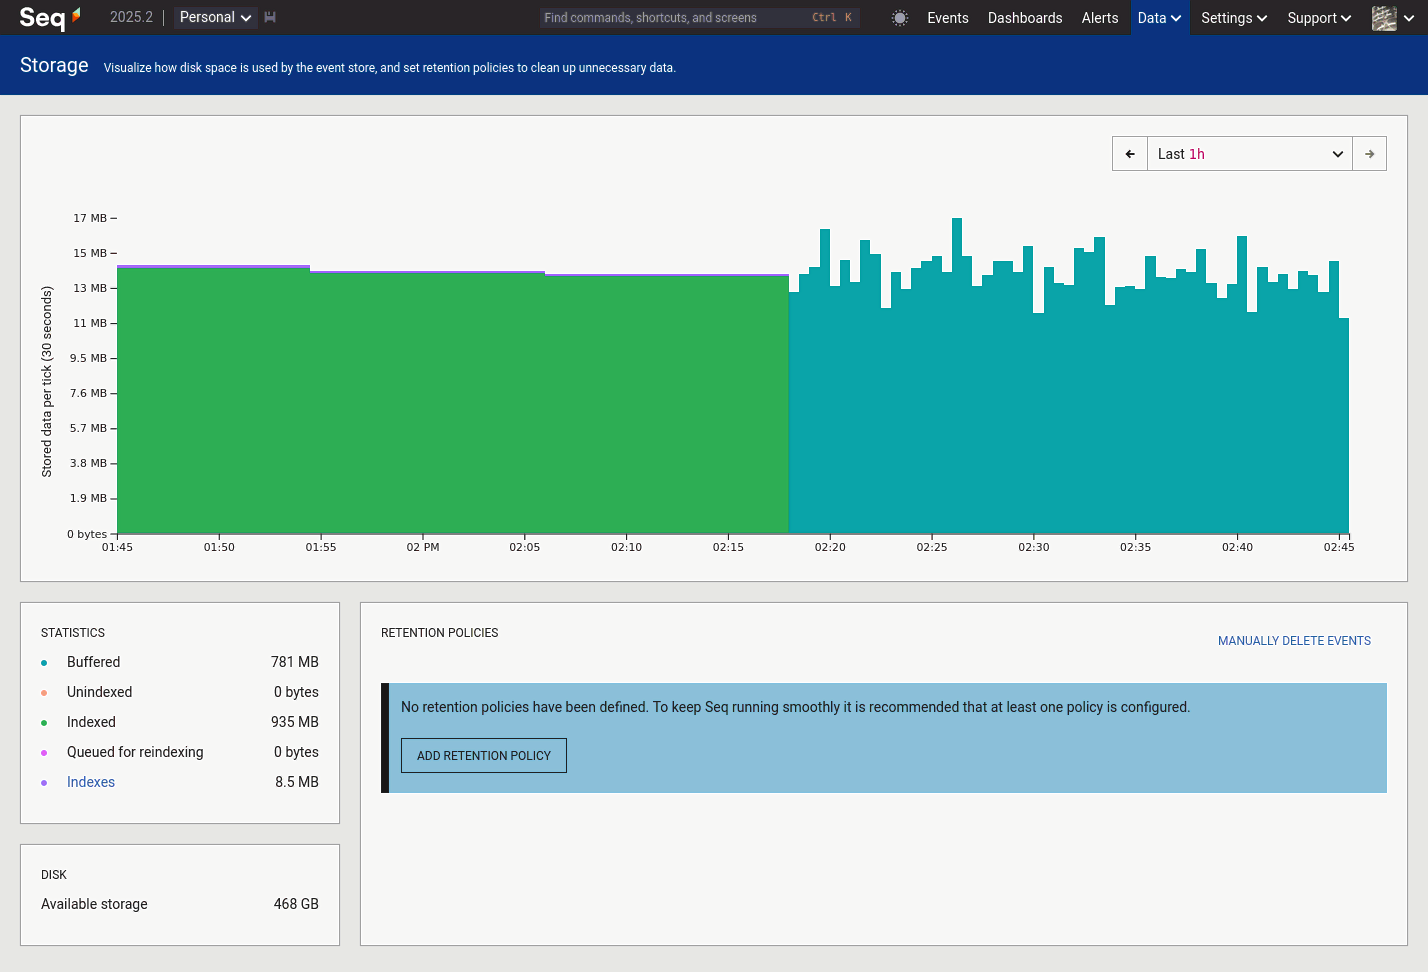
Here you can see the relative on-disk sizes for the same OpenTelemetry demo data set in:
2025.2
2026.1
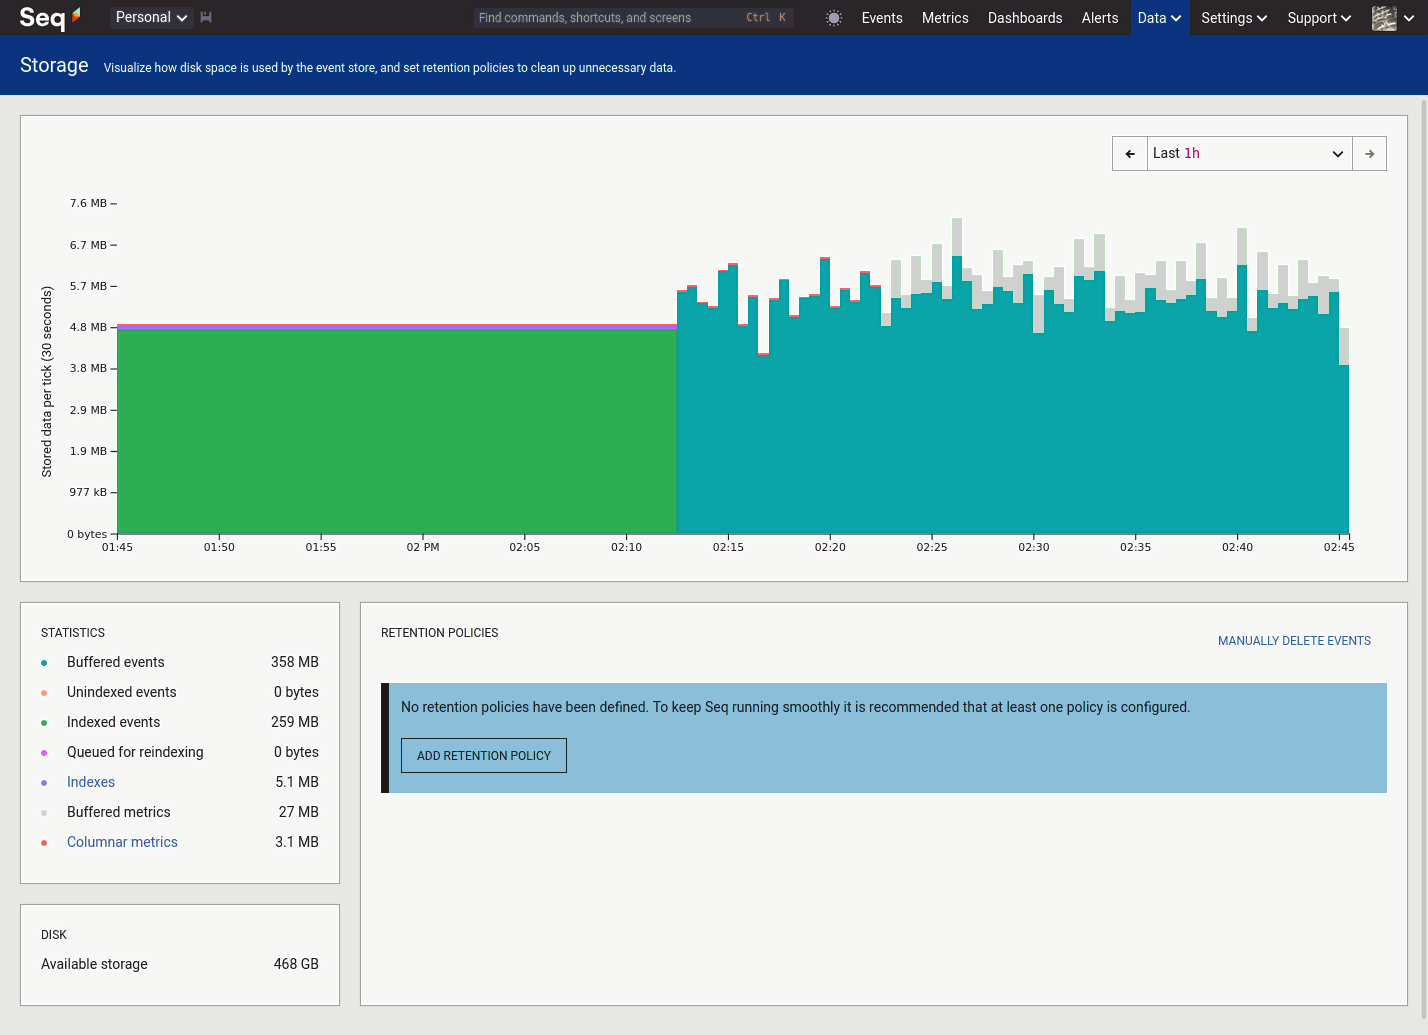
In this case, the new algorithm does 64% better than the older one. Your mileage will vary - compression performance depends heavily on content. Most Seq servers should see a significant reduction in storage consumption (and intra-cluster traffic) once older data gets aged out.
MCP Server and Agent Skills
This release includes an updated seqcli command-line client, which you can also download directly from the GitHub project.
The new seqcli skills install command installs and updates Seq-related agent skills:
dotnet tool install --global seqcli
seqcli skills install -a claude
Pass your agent of choice with -a <agent> to place the skill files in an appropriate location.
Currently, the skills cover querying Seq, and writing Seq App plug-ins. Our hope is to extend this set over time. You can contribute to these via the datalust/seqcli repository.
The new seqcli also exposes seqcli mcp run, a local MCP server with endpoints that help agents search and query logs. The seqcli mcp install command sets the MCP server up according to the conventions used by the specified agent.
seqcli mcp install -a claude
Set SEQCLI_CONNECTION_SERVERURL and SEQCLI_CONNECTION_APIKEY to point the MCP server at your Seq instance.
We've also made improvements across the command-line interface to improve direct usage by AI agents, so if your preference is for a CLI rather than an MCP server, this release is still for you!
Other Changes
This release includes some great smaller changes that you can read about in the GitHub release milestone here.
Upgrading to Seq 2026.1
Seq 2026.1 is a highly-compatible in-place upgrade. On Windows, running the new Seq MSI and clicking through the install dialog is sufficient. Under Docker, simply pull the datalust/seq:latest image tag and restart.
On downgrading: immediate downgrades, in the case of a failed installer, are supported without any special steps. After starting Seq 2026.1, data migration will occur, and the instance should thereafter only be downgraded with assistance from Seq support.
Download Seq 2026.1 for Windows, or pull datalust/seq from Docker Hub or AWS ECR. We'd love to hear how you go! Feedback and bug reports are welcome via our support address, issue tracker, and discussion forum.