Metrics Overview (Preview only)
Metrics support is currently only available in preview releases. Preview MSIs are now on the Seq download page and
datalust/seq:previewis ready to pull from Docker Hub.
Metrics enable efficient collection and processing of quantitative data. Metrics are described by the following properties:
| Property | Description |
|---|---|
| Name | A name for the values being recorded. E.g. http.server.request.duration. |
| Kind (Instrument type) |
|
| Unit | A unit of measure, for example seconds, bytes, transactions. |
| Description | A sentence or short paragraph explaining the meaning of the metric samples. |
In addition to their value, metric samples may have a set of attached attributes (also known as labels or dimensions). This additional metadata, similar to the properties on structured log events, may be used to filter and group the metric samples.
Getting metrics into Seq
Sending metrics with the OpenTelemetry SDK
Seq ingests metrics via the gRPC and HTTP/protobuf variants of the OpenTelemetry OTLP protocol. To send metrics to Seq configure the OpenTelemetry SDK for your programming language. The complete documentation for this is provided by the OpenTelemetry project.
For .NET, the instructions vary for console applications and ASP.NET Core applications.
Aggregation temporality
OpenTelemetry sums (counters) can be configured at the source to send either a running total since an application/service started (cumulative temporality), or the difference since the last sample was taken (delta temporality). Seq works best with delta temporality, which can be specified either in code using the OTLP metrics exporter options, or with an environment variable:
OTEL_EXPORTER_OTLP_METRICS_TEMPORALITY_PREFERENCE=Delta
Sums ingested with the incorrect temporality preference are converted to gauges on arrival and will appear as ever-increasing/sawtooth patterns when charted in Seq.
HTTP/protobuf endpoint
Configure your OpenTelemetry metrics source as follows.
| Parameter | Value | Example |
|---|---|---|
| Protocol | http/protobuf |
|
| Endpoint | /ingest/otlp/v1/metrics on any port served by Seq |
https://seq.example.com/ingest/otlp/v1/metrics |
| Headers | Send your Seq API key in X-Seq-ApiKey |
X-Seq-ApiKey: abcd1234 |
gRPC endpoint
If your installation meets the requirements for gRPC configure your OpenTelemetry metrics source with:
| Parameter | Value | Example |
|---|---|---|
| Protocol | grpc |
|
| Endpoint | The HTTPS root URL identifying your Seq server | https://example.com |
| Headers | Send your Seq API key in X-Seq-ApiKey |
X-Seq-ApiKey: abcd1234 |
Scraping Prometheus endpoints
The OpenTelemetry collector can be configured to scrape Prometheus endpoints and forward the data to a Seq OTLP endpoint.
The following OpenTelemetry collector configuration reads Prometheus metrics from node-exporter:9100 and forwards them to Seq at https://seq.example.com.
## OpenTelemetry Collector Configuration
## Scrapes a Prometheus endpoint and forwards metrics via OTLP with delta temporality

receivers:
  prometheus:
    config:
      scrape_configs:
        - job_name: "node-exporter"
          scrape_interval: 30s
          static_configs:
            - targets: ["node-exporter:9100"]

processors:
  cumulativetodelta:

exporters:
  otlphttp:
    endpoint: "https://seq.example.com/ingest/otlp"
    headers:
      "X-Seq-ApiKey": "abcd1234"

service:
  pipelines:
    metrics:
      receivers:  [prometheus]
      processors: [cumulativetodelta]
      exporters:  [otlphttp]
Finding metrics
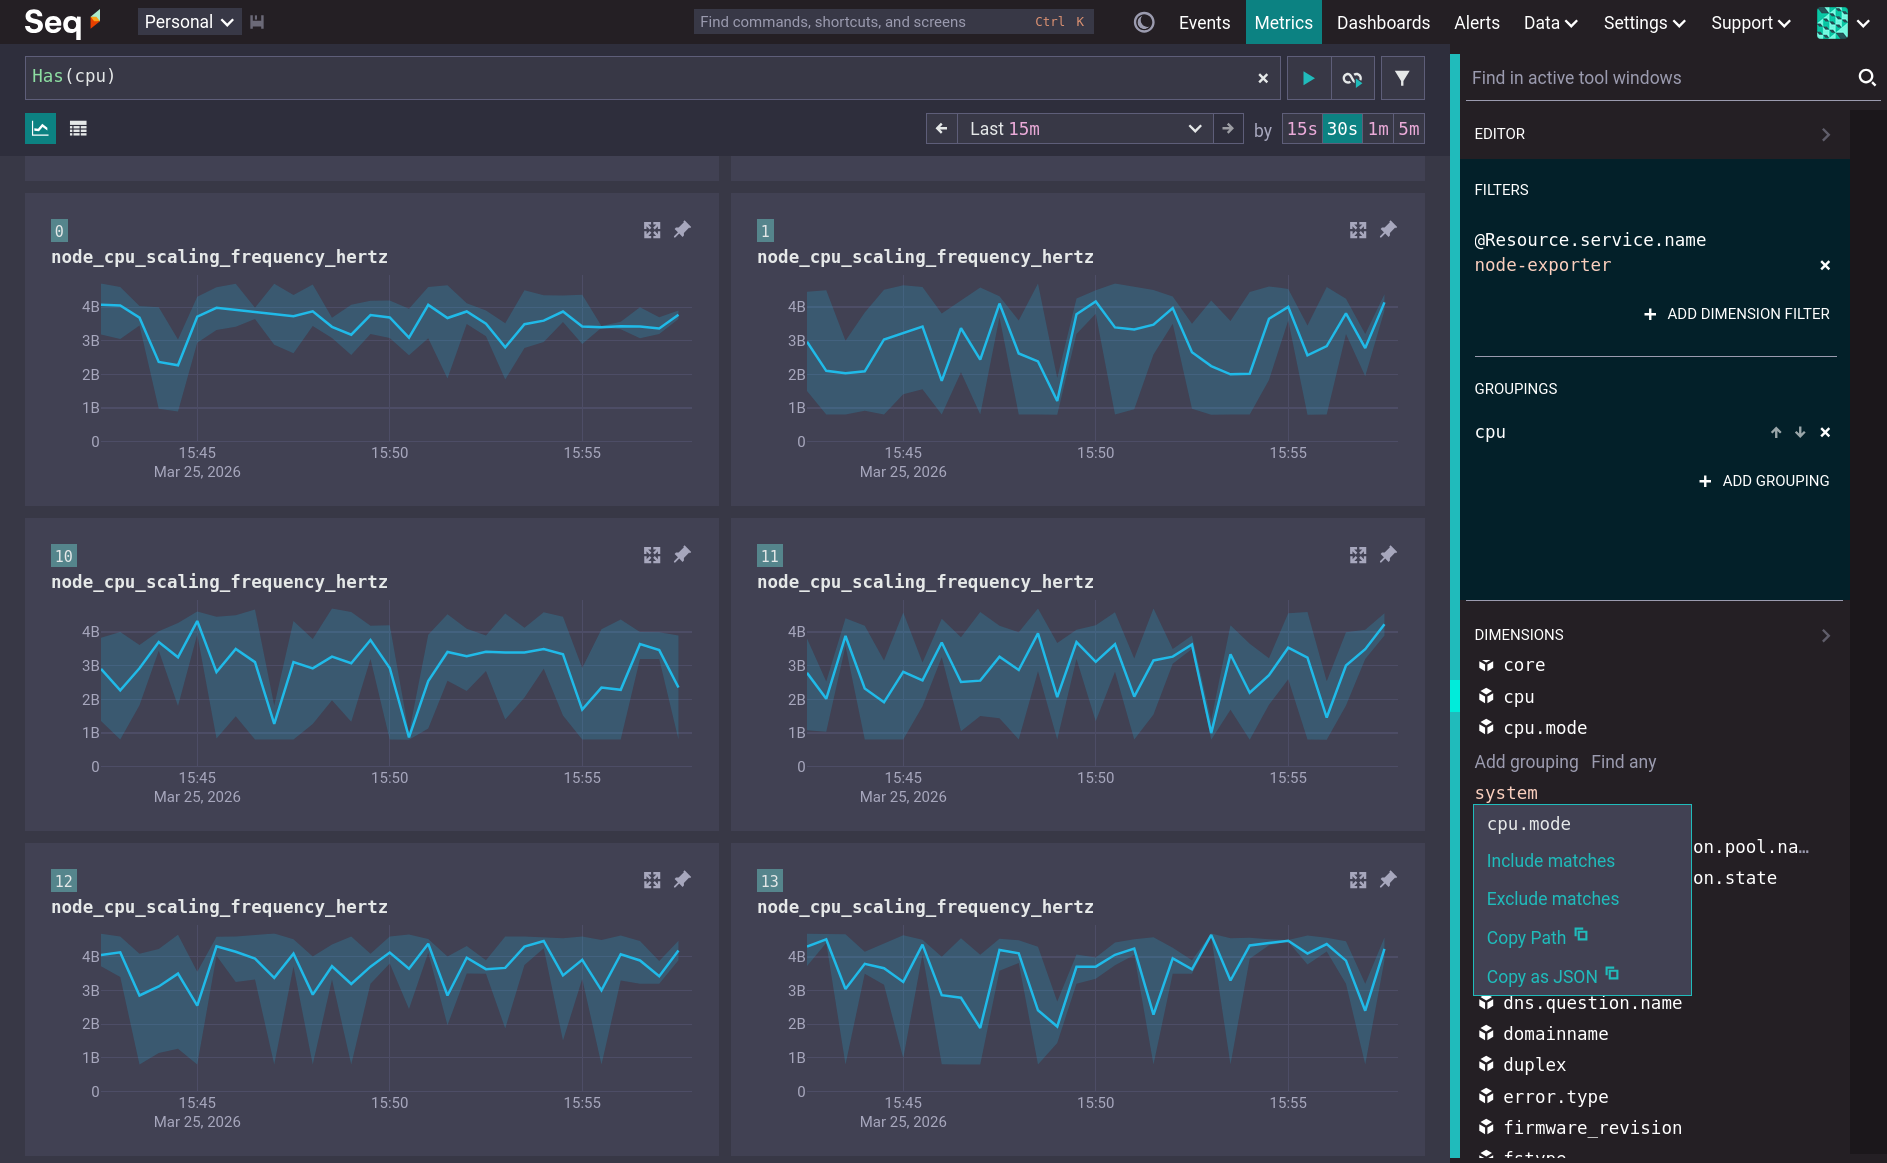
By default, Seq renders charts for all metrics in the selected time range, grouped by @Resource.service.name and @Scope.name. Click a metric name to view just that metric.
The group labels are shown as colored rectangles with each chart. Clicking on one will filter the view to that group. Drag a selection on a chart to filter the entire view to that time range.
The Dimensions tool window shows the available attributes for the current metrics. Use it to view attribute values, manage grouping, and filter by attribute values.
Metrics search
The search box at the top of the Metrics screen accepts the same search syntax as the Seq Events screen. Free text is matched against metric names and descriptions, while expressions are executed in the context of the attributes attached to each metric sample.
Examples
To find metrics containing cpu in their name or description, just type it in:
cpu
Any input that is not recognized as a valid search expression will be matched as free text against the name and description.
More complex text searches can use logical operators:
"cpu" and not "host"
Dimensions (resource, scope, and sample-level attributes) are referred to in searches directly by name:
@Resource.service.name like `%api%`
Expressions and text search can be combined:
"cpu" and mode = 'user'
To show a single metric only, enclose it in double quotes to form a text expression matching its name:
"http.request.duration"
Customizing the visualization
Expand a chart to customize its visualization. When a chart is expanded the Dimensions tool window changes to show only the attributes applicable to the maximized chart. Changing the chart to use a logarithmic scale can be useful when there is a large difference between the smallest and largest values.
Pinning metrics
A metric chart can be pinned from either the grid view or the expanded view. Pinning freezes a chart's configuration such that changes to filters and groups are not applied to the pinned chart. Changes to time range and time grouping are applied to all charts.
Charts are sorted first by if they are pinned, then by their metric name and then by their group keys.