Managing Storage
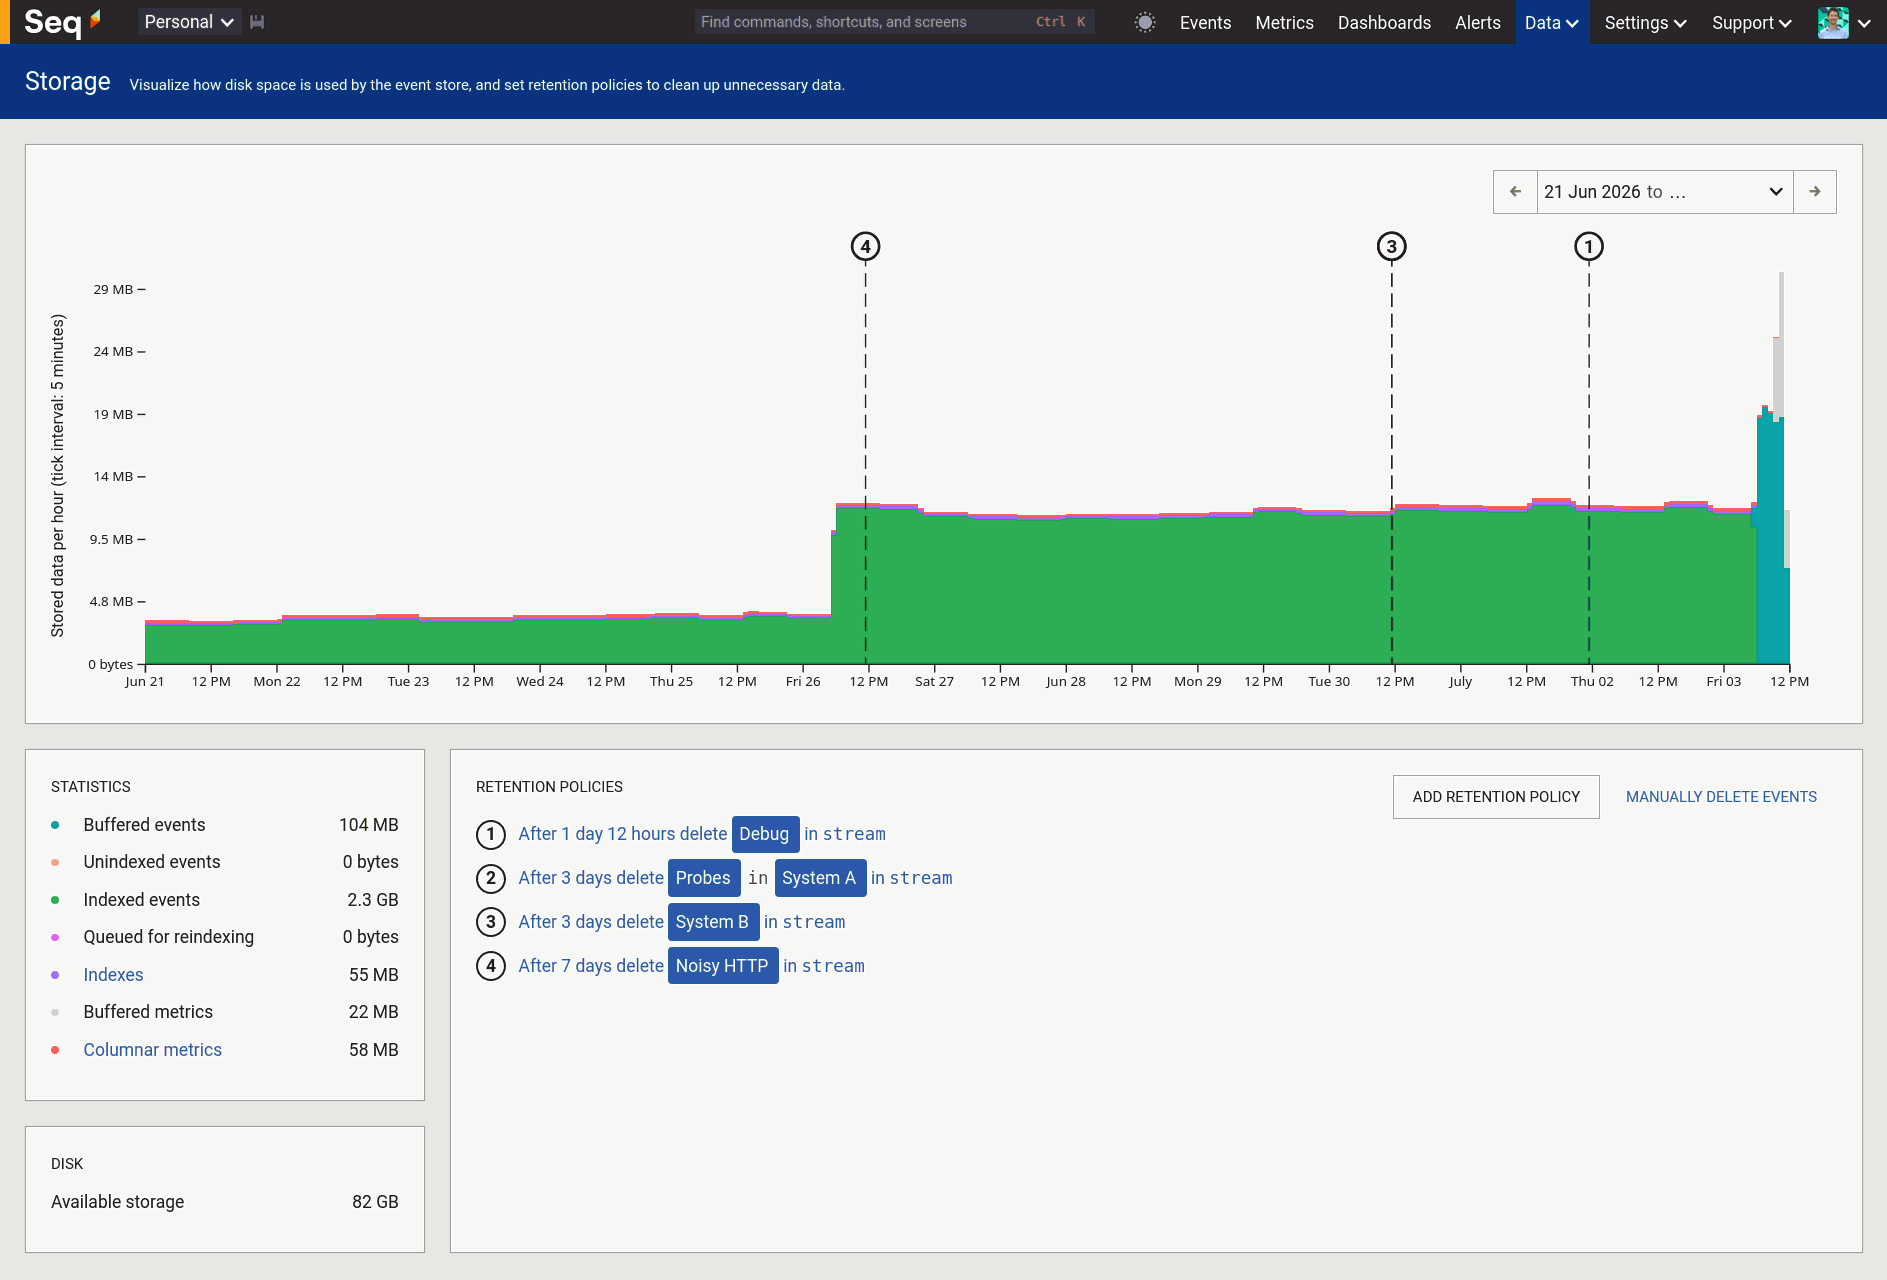
Data > Storage gives you an idea of how effectively retention policies are reclaiming disk space. It includes a chart that shows how much space is being used now by events ingested in the past. It does not track disk usage over time, which should remain fairly constant on a healthy server.
Interpreting the chart
Statistics
The Storage View visualizes event data that may be stored on disk in one of a number of states.
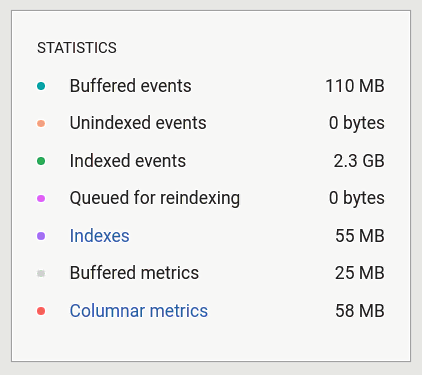
- Buffered events: Recently ingested, out of order logs and traces.
- Unindexed events: Coalesced and ordered, but not yet indexed.
- Indexed events: Coalesced and ordered logs and traces that have associated indexes.
- Queued for reindexing: Coalesced and ordered but indexes are out of date. This happens to all data when signals/indexes are created or modified.
- Indexes: Signal indexes and expression indexes.
- Buffered metrics: Recently ingested, out or order metrics.
- Columnar metrics: Metrics coalesced into column oriented files.
Are retention policies reclaiming space?
If retention policies are effective you should notice a drop in the area under the chart at the point where the policy is applied.
If retention policies don’t seem to be effective then you can look at the shape of retained data and see if there’s a different filter that would remove more data as it becomes unnecessary.
Are indexes being churned?
When a signal is created or updated the green indexed portions of the chart will become pink, indicating that there’s reindexing work to do. This is done after retention policies are processed approximately every 10 minutes.
If the chart appears to spend more time pink than green, then I/O bandwidth and core count may need to be increased to improve overall efficiency.